

1. Gross domestic product decreased by 0.1 per cent in 2014
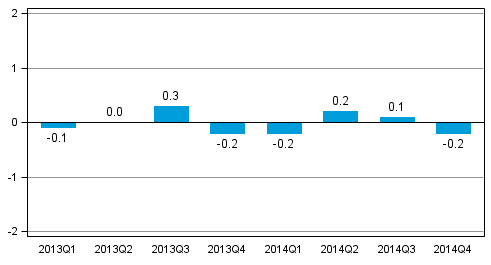
The volume of GDP fell by 0.1 per cent last year. Over the October to December period, gross domestic product decreased by 0.2 per cent from the previous quarter. Compared with the fourth quarter of 2013, GDP also contracted by 0.2 per cent.
Figure 1. Volume change of GDP from the previous quarter, seasonally adjusted, per cent
The economic development in 2014 was quite steady measured by gross domestic product. According to the preliminary data, slightly less GDP was, however, accrued than in the previous year, and because the employment situation weakened over the year, it can be said that last year was the third successive year of downturn for Finland's economy.
In the first quarter, the drop in exports and gross fixed capital formation depressed the gross domestic product by 0.2 per cent. The picking up of exports in the second quarter also turned gross domestic product into a temporary growth path but in the fourth quarter, the gross domestic product again decreased slightly as private consumption slowed down.
According to preliminary data compiled by Eurostat, GDP in the EU-28 area grew by 0.4 per cent in the fourth quarter of 2014 compared to the previous quarter. In the whole year 2014, GDP in the EU area increased by 1.4 per cent.
1.1 Production
In the last quarter, the volume of value added in the entire economy decreased by 0.4 per cent from the previous quarter. In the whole of 2014, value added amounted to the same as in 2013.
Measured in euros, value added decreased most in the electronics industry, construction and education, health and social services. Information and communication services increased their value added most in 2014.
Figure 2. Changes in the volume of value added in the fourth quarter of 2014 compared to one year ago (working day adjusted, per cent)
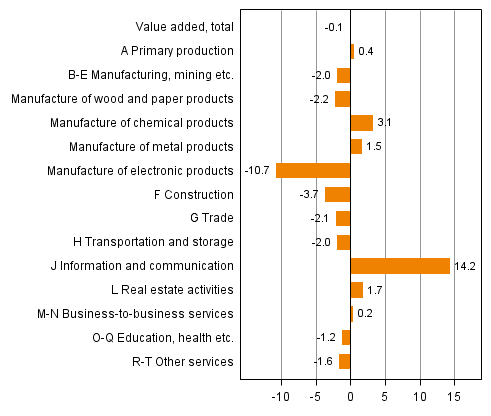
Figure 3. Changes in the volume of value added in the fourth quarter of 2014 compared to the previous quarter (seasonally adjusted, per cent)
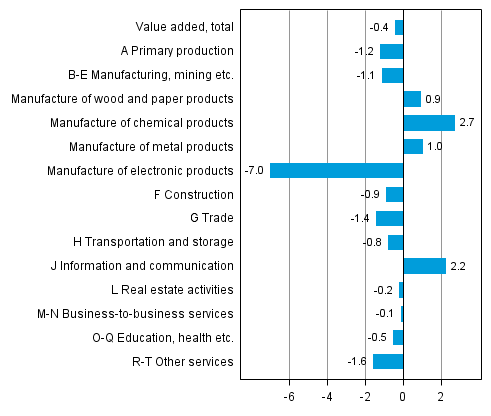
The volume of value added in primary production, that is, agriculture, forestry and fishery, went down by 1.2 per cent in October to December from the previous quarter.
Primary production grew by 1.4 per cent over the whole of 2014. The volume of value added in agriculture grew by 3.6 per cent but current-priced value added, in turn, decreased by 4.5 per cent as a result of a drop in prices. In forestry, the value added grew by 0.1 per cent in 2014.
In the last quarter, the value added of industries (industries B to E) decreased by 1.1 per cent from the previous quarter.
In the whole of 2014, the volume of value added in manufacturing decreased by 1.3 per cent. In the forest industry, value added went down by 0.6 per cent, in the metal industry by 0.7 per cent, and in the electrical and electronics industry by 4.6 per cent. The only bright spot in manufacturing was the chemical industry, where value added grew by 3.9 per cent.
From October to December, the volume of value added in construction diminished by 0.9 per cent from the previous quarter. In the whole of 2014, value added in construction fell by 3.6 per cent.
From October to December, the volume of value added in service industries decreased by 0.2 per cent.
In the whole of 2014, the volume of value added in service industries went up by 0.7 per cent. In trade, value added fell by 0.4 per cent and in transport services by 1.5 per cent. Value added in information and communication increased by 8.9 per cent. Business activities (M-N) grew by 0.1 per cent.
Value added in financial intermediation and insurance increased by 9.3 per cent last year. Value added in financial intermediation services was boosted in particular by increased commission income.
1.2 Imports, exports, consumption and gross fixed capital formation
The volume of total demand in the national economy contracted by 0.7 per cent in 2014. Demand was depressed in particular by low gross fixed capital formation. The balance for goods and services, which is the difference between imports and exports, showed a deficit of EUR 846 billion last year.
Figure 4. Changes in the volume of main supply and demand items in the fourth quarter of 2014 compared to one year ago (working day adjusted, per cent)
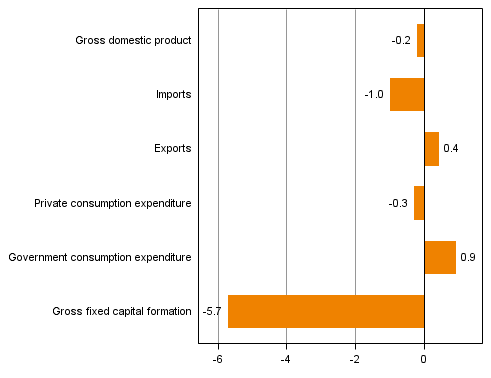
Figure 5. Changes in the volume of main supply and demand items in the fourth quarter of 2014 compared to the previous quarter (seasonally adjusted, per cent)
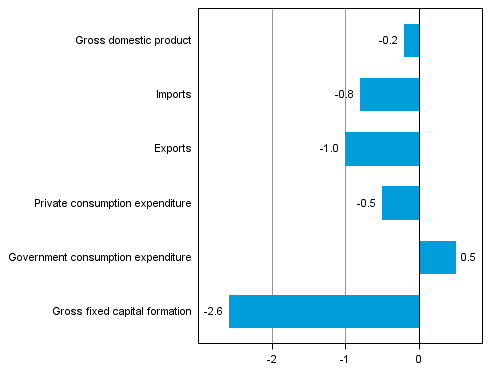
Over the October to December period, the volume of exports decreased from the previous quarter.
The volume of exports decreased by 0.4 per cent over 2014. Exports of goods grew by 1.1 per cent, but exports of services fell by four per cent.
From October to December, the volume of imports went down by 0.8 per cent from the previous quarter.
The volume of imports decreased by 1.4 per cent over 2014. Imports of goods went up by one per cent, but imports of services contracted by 7.1 per cent.
In the last quarter, the volume of private consumption went down by 0.5 per cent from the previous quarter. The volume of public consumption expenditure grew by 0.5 per cent.
In the whole of 2014, the volume of private consumption decreased by 0.2 per cent while the volume of public consumption expenditure increased by 0.2 per cent.
In the last quarter, the volume of investments grew by 2.6 per cent from the previous quarter. Gross fixed capital formation in construction decreased by 1.4 per cent. The volume of gross fixed capital formation in machinery, equipment and transport equipment fell by 3.4 per cent.
The volume of gross fixed capital formation contracted by 5.1 per cent over 2014. Gross fixed capital formation in residential buildings diminished by 5.5 per cent and in non-residential buildings by 4.3 per cent. The volume of gross fixed capital formation in civil engineering went down by 0.7 per cent. Gross fixed capital formation in machinery, equipment and transport equipment decreased by 10.7 per cent. Gross fixed capital formation in intellectual property products that mainly consisted of R&D expenditure and gross fixed capital formation in software decreased by one per cent.
1.3 Employment
The number of employed persons did not change in the fourth quarter, there was the same number of employed persons as in the previous quarter. The number of hours worked in the national economy fell by 0.1 per cent from the previous quarter.
In the whole of 2014, the number of employed persons fell by 0.3 per cent and the number of hours worked by 0.2 per cent.
Labour productivity, or the volume of gross value added per hour worked, grew by 0.2 per cent last year.
According to Statistics Finland’s Labour Force Survey, the rate of unemployment in the October to December period was 8.4 per cent. In the corresponding period of 2013, the rate of unemployment was 7.7 per cent. The unemployment rate for the whole of 2014 was 8.7 per cent.
1.4 Prices went up a little
The economy’s overall price level is estimated to have risen by 1.1 per cent last year as measured by the GDP price index.
Last year, the Consumer Price Index rose by 1.0 per cent, but the price index of household consumption expenditure in National Accounts went up by 1.5 per cent. In National Accounts, the prices of housing services are measured with changes in market rents, whereas the Consumer Price Index also takes into consideration the expenditure on owner-occupied housing. The methods used in National Accounts and in the Consumer Price Index for measuring development in the prices of insurance and financial intermediation services also deviate from each other.
The terms of trade improved a little because export prices decreased by 1.7 per cent and import prices by 1.8 per cent.
1.5 National income contracted in real terms
Net national income grew by 0.7 per cent in nominal terms, but contracted by 0.5 per cent real terms last year, and was EUR 30,200 per capita. Finland's gross national income amounted to EUR 204 billion last year. Gross national income fell by 0.4 per cent in real terms, i.e. more than gross domestic product because the property income paid to the rest of the world increased.
Households’ wage and salary income went up by 0.6 per cent but employers’ social insurance contributions remained unchanged. In all, the share of compensation of employees in national income was 61.5 per cent. The respective proportion in the previous year was 61.6 per cent. Property and entrepreneurial income in the national economy increased by 1.4 per cent and its share of the national income rose slightly to 22.4 per cent. The respective proportion in the previous year was 22.2 per cent.
1.6 Enterprises' financial position improved
Non-financial corporations' operating surplus describing profits from their actual operations went up by one per cent from the previous year. By contrast, their entrepreneurial income grew by ten per cent, because foreign investments were estimated to have generated more profit than before and interest expenses decreased. Entrepreneurial income also takes into consideration property income and paid interests and rents, and corresponds roughly with profit before payment of taxes and dividends.
Figure 6. Non-financial corporations, operating profit from the operations proper before payment of taxes and dividends, etc. (= operating surplus, left column) and after (= net saving, right column), EUR billion
Last year, non-financial corporations paid 17 per cent less direct taxes than in the year before due to the cut in the corporation tax. Non-financial corporations are estimated to have paid five per cent more dividends.
Non-financial corporations’ net lending, or financial position, showed a surplus of EUR 6.2 billion, as against EUR 4.3 billion in the previous year. The financial position was also improved by the fact that fixed investments in Finland diminished by six per cent last year.
The financial position of financial and insurance corporations showed a surplus of EUR 0.4 billion while it was EUR 0.5 billion in the previous year. Financial corporations’ interest income (financial intermediation services indirectly measured) decreased and commission income increased. The credit and deposit stock rose but the level of interest rates was lower than in the year before. Insurance corporations' income from insurance premiums grew clearly.
1.7 General government deficit 3.4 per cent of GDP
Non-financial corporations’ net lending, or financial position, showed a deficit of EUR seven billion, while the deficit was EUR 5.1 billion in the previous year. The deficit was 3.4 per cent of the gross domestic product, which exceeds the three per cent threshold value of the European Union's Growth and Stability Pact for the first time since 1996.
Last year, the financial position of central government showed a notable deficit for the sixth successive year. The deficit (net borrowing) was EUR eight billion, while one year before it was EUR 7.4 billion.
State revenues from taxes went up by 1.1 per cent. Tax revenues were boosted, for example, by a change to the tax withholding on dividends and changes to certain bases of taxation. Tax revenues were, in turn, depressed by the corporation tax rate being lowered from 24.5 to 20 per cent.
Current transfers to local government (incl. repayments of value added tax) went up by 0.1 per cent. Current transfers to social security funds grew by 3.9 per cent. In nominal terms, final consumption expenditure rose by 0.8 per cent and investments by 2.6 per cent.
The deficit of local government (municipalities and joint municipal authorities) was EUR 1.9 billion, having been EUR 1.5 billion in the year before. Municipalities' tax revenues grew by 2.2 per cent mainly as a result of increases in the municipal tax and real estate tax. Final consumption expenditure went up by 1.8 per cent in nominal terms mainly due to purchasing of services, and gross fixed capital formation is estimated to have grown by 2.9 per cent.
The surplus of employment pension schemes decreased slightly from the previous year. The surplus was now EUR 3.5 billion, while one year before it was EUR 3.7 billion. The surplus does not include holding gains in assets. Revenues from pension contributions grew by 2.6 per cent, but employment pensions paid by employment pension funds increased by 4.7 per cent. Other social security funds were EUR 0.6 billion in deficit mainly due to increased unemployment expenses. In the previous year, their economy was in balance.
Figure 7. General government surplus/deficit, per cent of GDP
The so-called EDP debt, or consolidated gross debt, of general government grew to EUR 121 billion. Relative to GDP, it increased to 59.3 per cent, i.e. by 3.5 percentage points. Statistics Finland will publish the deficit and debt data that must be reported to the European Commission on 31 March 2015. The deficit and debt data published here may become revised in that connection.
General government's share of the gross value added was 21 per cent. The proportion of total public expenditure to GDP grew to 58.8 per cent. In the previous year, the proportion was 57.8 per cent. Total public expenditure includes a notable amount of internal public sector expenses that are included in the calculations twice.
The tax ratio, or the proportion of taxes and statutory social security contributions of GDP, was 44.1 per cent last year. The tax ratio increased by 0.2 percentage points from the previous year.
1.8 Households’ real income decreasing
In 2014, households’ disposable income increased by 0.4 per cent in nominal terms but decreased by 1.1 per cent in real terms. Households’ adjusted disposable income grew by 0.7 per cent in nominal terms but went down by 0.7 per cent in real terms. Adjusted income also takes into consideration welfare services, i.e. the individual services that general government and organisations produce for households, such as educational, health and social services.
Figure 8. Annual change in households’ disposable real income (left column) and household's adjusted real income (right column), per cent
Wages and salaries received by households went up by 0.6 per cent and social benefits by 4.5 per cent. The wages and salaries sum went up due to the risen level of earnings as employment weakened. Social benefits increased because the number of pensioners and unemployed grew. Households’ property and entrepreneurial income went up by 0.9 per cent.
Direct taxes paid by households increased by 5.8 per cent, i.e. clearly more than income. Consumption expenditure grew by 1.4 per cent in nominal terms but was lower than disposable income. The savings rate, i.e. the ratio of savings to disposable income, was positive in 2014, 0.8 per cent.
Households’ fixed investments went down by 5.2 per cent in nominal terms as newbuilding decreased. The financial position of households showed a deficit of EUR 3.3 billion, while the deficit in the previous year was EUR 3.6 billion.
Households’ indebtedness rate was 122 per cent at the end of 2014, in other words, it grew by 3.5 percentage points over the year. The indebtedness rate expresses the ratio between the loans and annual disposable net income in accordance with financial accounts. Annual financial accounts data on the situation at the end of the year are preliminary assessments.
1.9 Current account still shows a deficit
The deficit of the current account was EUR 3.7 billion in 2013, while one year before it was EUR 3.8 billion. When imports are also valued at FOB price (at the border of the export country) and not at CIF price (at the border of the import country), as is done in the foreign trade statistics of Finnish Customs, the goods trade showed a surplus of EUR 0.7 billion.
However, the balance of services trade showed a deficit of EUR 1.6 billion. The data on international trade in services are very preliminary. Slightly more property income was received from the rest of the world than was paid to it. The current transfer outflow was clearly higher than received income transfers.
1.10 Next revisions in June and July 2015
National accounts data concerning the first quarter of 2015 will be released on 4 June 2015. National Accounts for 2014 with more detailed data contents will be released on 9 July 2015.
These preliminary data are based on the information on economic development available by 23 February 2015. More information on the national accounts methods can be found on Statistics Finland’s website at: http://tilastokeskus.fi/til/vtp/men_en.html and http://tilastokeskus.fi/til/ntp/men_html .
Source: Source: National Accounts. Preliminary annual data and 4th quarter of 2014 Statistics Finland
Inquiries: Olli Savela 029 551 3316, Tuomas Rothovius 029 551 3360, kansantalous@stat.fi
Director in charge: Leena Storgårds
Updated 2.3.2015
Official Statistics of Finland (OSF):
Annual national accounts [e-publication].
ISSN=1798-0623. 2014,
1. Gross domestic product decreased by 0.1 per cent in 2014
. Helsinki: Statistics Finland [referred: 16.3.2025].
Access method: http://stat.fi/til/vtp/2014/vtp_2014_2015-03-02_kat_001_en.html