

Published: 8 May 2009
Industrial output declined further in March
According to Statistics Finland, industrial output adjusted for working days was 16.5 per cent lower in March 2009 than twelve months earlier. In February, industrial output fell by 21.5 per cent year-on-year. Over the January to March period industrial output has shrunk by good 20 per cent from twelve months back.
Output continued to fall again in most main industries. In the chemical industry output declined by just short of 17 per cent. Output in the electrical and electronics industry fell by almost 18 per cent from one year back in March. The metal industry's output fell by nearly 20 per cent. Output fell most in the forest industry, by 30 per cent. The food industry seems to be the first one to have found a "path of recovery" as its output showed 0.2 per cent growth in March.
Capacity utilisation rate in manufacturing was 70 per cent in March, which was 13.5 percentage points lower than in last year's corresponding month. In the forest industry, capacity utilisation rate was 74 per cent, which was 13 percentage points lower than one year earlier.
Working day adjusted change in industrial output by industry 3/2008-3/2009, %, TOL 2008
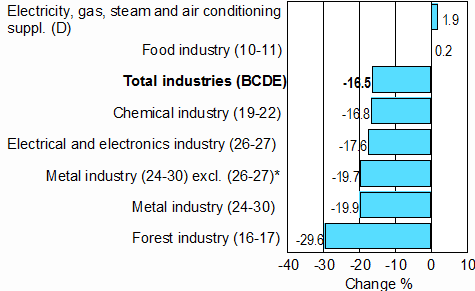
*Metal industry excl. manufacture of electrical and electronic products
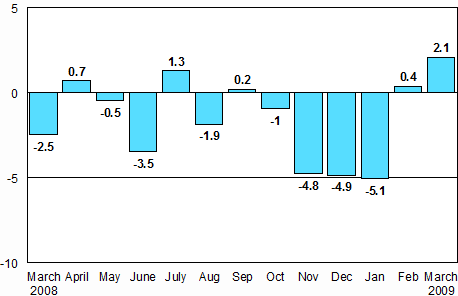
Seasonally adjusted change in industrial output (BCDE) from previous month, %, TOL 2008
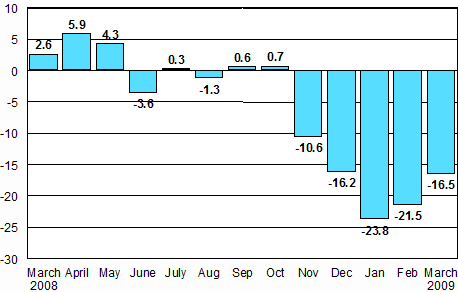
Working day adjusted change in industrial output (BCDE) from corresponding month of previous year, %, TOL 2008
Estimation
In many months of the year the volume index of industrial output uses estimation in industry 26-27, Electrical and electronics industry. In this industry Statistics Finland estimates data 8 times a year. Not all of the data on this industry are at Statistics Finland's disposal at the times of publication. For example, estimated data for January-February become revised in May when data are released for March. As the weight of the industry (26-27) is 20 per cent in total industries, using estimation may influence the point figures and change percentages of the volume index of industrial output even if previous data on other industries do not become revised. Further information is available under Revision in these statistics.
Revised data for March will be published at 9 am on 10 June 2009 in connection with the release of industrial output data for April. Because of the method used, seasonally adjusted figures for previous months may change even if the original figures do not become revised. The seasonally adjusted figures will also be adjusted for working days.
Source: Volume Index of Industrial Output 2009, March. Statistics Finland
Inquiries: Mr Kari Rautio +358 9 1734 2479, volyymi.indeksi@stat.fi
Director in charge: Hannele Orjala
- Tables
-
Tables in databases
Pick the data you need into tables, view the data as graphs, or download the data for your use.
Last updated 8.5.2009
Official Statistics of Finland (OSF):
Volume index of industrial output [e-publication].
ISSN=1798-9272. March 2009. Helsinki: Statistics Finland [referred: 26.4.2024].
Access method: http://www.stat.fi/til/ttvi/2009/03/ttvi_2009_03_2009-05-08_tie_001_en.html