Published: 18 December 2015
Productive capital in manufacturing continued to peter out in 2014
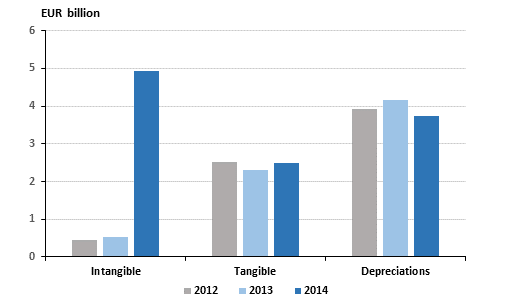
Investments in fixed assets by manufacturing (industry C) amounted EUR 7.5 billion in 2014. The sum in the year before was EUR 2.8 billion. The increase was merely due to a large business transaction in the electronics industry producing goodwill value growth that raised the amount of intangible investments to EUR 4.9 billion. At the same time, depreciations of industrial enterprises have in recent years clearly exceeded the amount of tangible investments in fixed assets. This type of development will inevitably lead to petering out of the production capacity of manufacturing in Finland. These data derive from Statistics Finland's structural business and financial statement statistics for 2014.
Investments in manufacturing

The turnover of manufacturing was EUR 130.3 billion in 2014. One year previously, turnover amounted to EUR 135.1 billion so the drop was 3.6 per cent. One-half of the fall in turnover came from the metal industry. Most of the decrease in turnover derived from other than the fall in domestic industrial output. According to the statistics on industrial output 2014, which describe the same period, the value of sold output was EUR 80 billion, which decreased by 1.2 per cent from the year before.
Weak improvement could be seen in the profitability of manufacturing measured by the operating margin. The result before financial items and taxes grew by EUR 380 million rising the operating margin by half a percentage point. The sales gains received due to large corporate acquisitions in the electronic industry increased the result for the financial period. Similarly, the tax refunds amounting to nearly EUR one billion received in the industry decreased the taxes paid by manufacturing to EUR 40 million. The combined result for the financial period of manufacturing enterprises was EUR 12.4 billion in 2014. The result of the year before was EUR 2.0 billion.
The data are based on the Tax Administration's business taxation data. The data have been supplemented with Statistics Finland's own inquiry.
Enterprises in Finland in 2014
The number of personnel employed by enterprises went down in nearly all industries. The fall was considerable particularly in the industries of manufacturing, trade and logistics. In the industry of education the fall in the number of personnel was significant in relative terms. The number of personnel grew only in the industries of health care, arts and entertainment, and food service and accommodation activities.
The total number of enterprises rose due to the growing number of primary production enterprises. In other industries the number of enterprises remained more or less on level with the previous year. The number of enterprises went down especially in manufacturing, trade and transportation and storage activities. Primary production included, the number of enterprises grew to some degree.
The number of enterprises with the biggest turnover of over EUR 200 million remained unchanged in 2014 from 2013. In smaller categories than this the development was varying between 2013 and 2014. The number of personnel fell in almost every size category of turnover. Exceptions to this were enterprises whose turnover was EUR 2 to 9.9 million, where the number of personnel grew somewhat, by under 2,000 employees.
By far, the largest share of enterprises operating in Finland are small. Enterprises of fewer than five staff-years employ nearly as many Finns as those employing over one thousand staff-years. However, the wages and salaries sum of the largest enterprises is considerably higher than that of smaller size category enterprises.
Most Finnish enterprises operate either as a limited company or as private practitioners of trade, i.e. natural persons. These legal forms constitute around 85 per cent of all enterprises. The number of enterprises operating as limited companies and natural persons increased in 2014 compared with 2013.
Source: Statistics Finland
Inquiries: Pirkko Nurmela 029 551 3519, Jaakko Salmela 029 551 3454, rakenne.tilastot@stat.fi
Director in charge: Mari Ylä-Jarkko
Publication in pdf-format (222.2 kB)
- Tables
-
Tables in databases
Pick the data you need into tables, view the data as graphs, or download the data for your use.
Appendix tables
- Revisions in these statistics
-
- Revisions in these statistics (18.12.2015)
Updated 18.12.2015
Official Statistics of Finland (OSF):
Structural business and financial statement statistics [e-publication].
ISSN=2342-6233. 2014. Helsinki: Statistics Finland [referred: 25.4.2024].
Access method: http://www.stat.fi/til/yrti/2014/yrti_2014_2015-12-18_tie_001_en.html

