3. High income earners invest their surplus money in listed shares
The share of the most common financial wealth item, or deposits, in financial assets has been declining for an extended period. Although wealth has moved to shares and funds, the share of deposits in financial assets still exceeds 40 per cent, while the proportion of listed shares and mutual funds is approximately 30 per cent.
Of all households, 39 per cent had listed shares and mutual funds. This proportion was the highest, or 40 per cent, for those aged 45 to 54, and the average value of investments was EUR 42,000. Owning assets of this type was equally common in the younger and older age groups, or households of those aged 35 to 44 and 55 to 64 years, but the amounts invested by these groups were considerably smaller than the amounts invested by those aged 45 to 54.
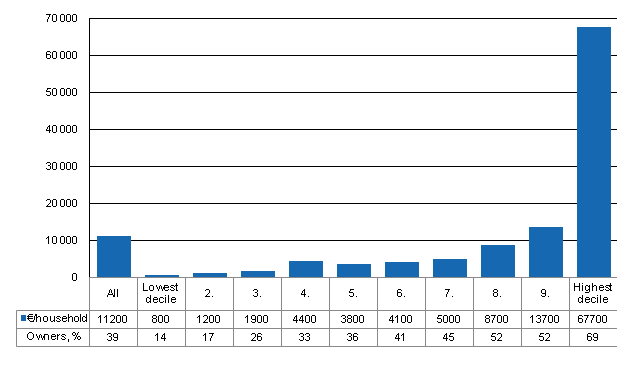
As income grows, households put an increasingly large share of their liquid assets into investments with a higher risk, such as listed shares and mutual funds. Investments in shares and funds thus only increases dramatically for those with the highest incomes (Figure 3). For the majority of the population, risk investments of this type are rather marginal. In the lowest income bracket (1st decile), only 14 per cent of households invested in shares and funds, while in the highest income bracket (10th decile), this share increases to approximately 70 per cent. The amounts invested also increase manifold; while the average for all households is some EUR 11,000, this figure for the highest income bracket was EUR 68,000. Financial assets are distributed less evenly than dwellings and other real assets, and the highest concentrations of investments are found in listed shares and savings in funds. In 2009, households in the highest income bracket owned 61 per cent of all assets in the form of shares and funds.
Figure 3. Households’ ownership of listed shares and mutual funds by income decile in 2009, EUR per household and share of households owning assets

Source: Households' assets
Inquiries: Markku Säylä (09) 1734 3410, Veli-Matti Törmälehto (09) 1734 3680
Director in charge: Riitta Harala
Updated 21.12.2011
Official Statistics of Finland (OSF):
Households' assets [e-publication].
ISSN=2242-3230. 2009,
3. High income earners invest their surplus money in listed shares
. Helsinki: Statistics Finland [referred: 19.4.2024].
Access method: http://www.stat.fi/til/vtutk/2009/vtutk_2009_2011-12-21_kat_003_en.html

