

Published: 20 March 2020
International trade in services grew significantly thanks to ICT services in the last quarter of 2019
Service exports grew by 11 per cent in the fourth quarter of 2019 compared to the corresponding quarter in 2018. Service imports grew by seven per cent. Exports of services amounted to EUR 8.4 billion and imports to EUR 8.8 billion. The surplus of international trade in services prevailing in the third quarter of 2019 thus turned again into deficit. The data appear from Statistics Finland's statistics on international trade in goods and services, which are part of balance of payments .
Figure 1. Imports and exports of services quarterly
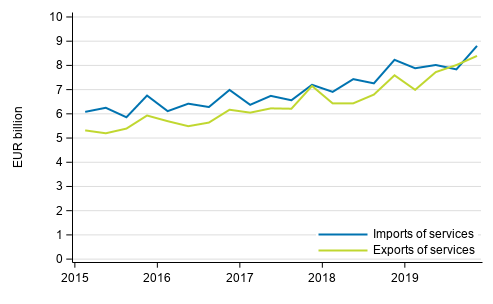
According to preliminary data for 2019, service exports grew by 14 per cent compared to 2018. Imports of services grew by nine per cent in 2019. The development in the last quarter of 2019 thus follows the development in the whole year.
The combined exports of goods and services in balance of payments terms grew by seven per cent and imports fell by one per cent in the last quarter of 2019 compared with the corresponding quarter in 2018. In balance of payments terms, goods exports grew by six per cent and goods imports fell by five per cent.
According to preliminary data for 2019, the combined exports of goods and services went up by six per cent from 2018. Correspondingly, imports of goods and services grew by two per cent in 2019.
The levels in customs terms and in balance of payments terms can differ, because goods trade in customs terms includes flows of goods where ownership does not change. In contrast, goods trade in balance of payments terms is based on change of ownership. In addition to the changes made to the customs data, goods trade in balance of payments terms includes sales and purchases from aboard to abroad.
Growth in exports centres on ICT, growth in imports is diverse
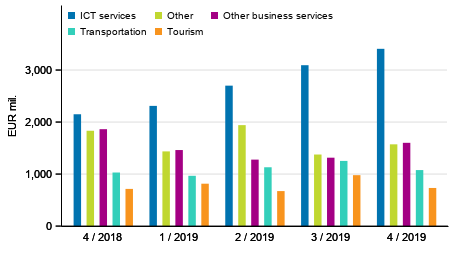
Telecommunications, computer and information services (ICT) covered 41 per cent of total service exports. The growth in this item continued strong, although the growth that accelerated during 2019 slowed down in the last quarter. Compared with the corresponding quarter of the year before, exports of telecommunications, computer and information services (ICT) grew by 59 per cent, while they went up by 84 per cent in the third quarter of 2019. It should be noted that the EUR 1.3 billion growth in exports of ICT services was bigger than in total service exports (EUR 0.8 billion). In other words, while exports of ICT services were growing strongly, exports of many other services went down compared to the corresponding quarter of the previous year. Exports items that fell most strongly were other business services and charges for the use of intellectual property n.i.e. Within other business services, exports of professional and management consulting services fell most strongly.
The differentiation of the development in exports of ICT services and other business services in the last two years is also essential when examining the development of exports. In the last quarter of 2017, exports of ICT services amounted to EUR 1.9 billion and exports of other business services to EUR 2.0 billion. In two years, exports of ICT services have started to grow strongly while exports of other business services have fallen. In the last quarter of 2019, exports of ICT services were two times bigger than those of other business services.
In service exports, the revision of charges for the use of intellectual property n.i.e. in the second quarter also stands out, which is visible as a 58 per cent growth compared to the quarter of the previous year. However, the level shift was not retained but on the contrary, exports of charges for the use of intellectual property n.i.e. fell in the third and fourth quarters.
Growth in service imports continued more widely than exports similarly as in earlier quarters of 2019. Most imports concerned other business services, EUR 3.3 billion out of total service imports of EUR 8.8 billion. Nearly one third of the EUR 0.6 billion growth came from imports of ICT services, good two thirds from growth in other business services. Imports of manufacturing services and of charges for the use of intellectual property n.i.e. grew, but imports of transport and construction went down almost as much in terms of euros..
Figure 2. Exports of services by service item
Exports of ICT services grew faster than total exports in 2019
According to preliminary annual data, exports grew strongly in 2019 to the United States as well as particularly to China and countries outside Europe, America, Asia and Africa. If the trend continues, it will show before long in the relative shares of trading partners.
When examining service exports for the whole 2019 in terms of euros, the most increased item was ICT services, where the EUR 4.2 billion growth was larger than growth in total exports (EUR 3.9 billion). Charges for the use of intellectual property n.i.e. also grew by eight per cent, but the growth focused on the early part of the year. Financial and insurance services also grew by 10 per cent on the annual level but by just EUR 50 million in terms of euros. The EUR 0.5 billion fall in exports of other business services was biggest in terms of euros.
According to preliminary data, imports of services grew by EUR 2.7 billion in 2019. Unlike growth in exports, growth in imports built on increases in several services. Although the EUR 2.2 billion growth in other business services was biggest, imports of ICT services also grew by EUR 0.5 billion (14%). In addition, imports of financial and insurance services grew by EUR 351 million (32%) and charges for the use of intellectual property n.i.e. by EUR 109 million (12%).
Because exports of services grew both in percentages and in terms of euros more than imports, the deficit of international trade in services contracted from EUR 2.6 billion to EUR 1.4 billion in 2019. In the third quarter of 2019, the balance of services was positive for the first time throughout the entire statistical reference period.
International trade with biggest trade partners slowed down, trade with the United States gains emphasis
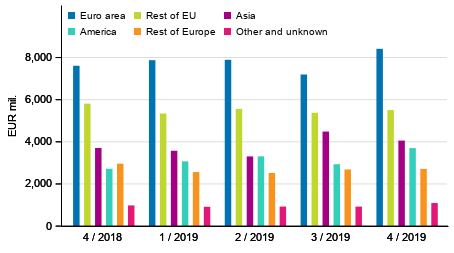
In the last quarter of 2019, exports of services grew by EUR 800 million, of which around 40 per cent came from growth in exports to North and South America, one third to Asia and only around 14 per cent to Europe.
Changes in the key trading partners are visible on the country level: in the last quarter of 2019, the United States accounted for 13 per cent of Finland’s service exports, while it was 11 per cent one year earlier. Sweden has lost its importance as services exported there fell by eight per cent from the year before and its share of Finland’s service exports has dropped in one year by two percentage points to 12 per cent. Similarly, service exports to Germany fell by seven per cent compared to the corresponding quarter of the previous year, and Germany's share of service exports from Finland went down from nine to seven per cent.
The corresponding change can be seen in imports of services. Good one half of the growth in service imports came from service trade with the United States and one tenth from trade with other American countries. One sixth of the growth in imports came from the growth in service imports from Asia and 11 per cent from Europe. The change is reflected in the relative shares of imports of trading partners: The share of the United States as an importing country has grown and that of Sweden fallen by three percentage points. This is explained not only by the growth in imports from the United States, but also by the contraction in services imported from Sweden. In contrast, there has not been significant changes in international trade in services with the neighbouring country Russia. Service exports to Russia rose and imports fell by two per cent.
According to preliminary annual data, exports grew strongly in 2019 to the United States as well as particularly to China and countries outside Europe, America, Asia and Africa. If the trend continues, it will show before long in the relative shares of trading partners.
Figure 3. Exports of goods and services in balance of payments terms by area
Statistics on international trade
The statistics on international trade in goods and services are part of balance of payments . The statistics comprise breakdowns of goods and services on a more detailed level. The guidelines and recommendations of the Balance of Payments Manual (BPM6) applied to balance of payments are consistent with the European System of Accounts (ESA 2010). National Accounts are published on quarterly and annual levels . Finnish Customs publishes data on goods trade across borders. Goods trade published by Finnish Customs is used as source data for the statistics on international trade in goods and services. Removals and additions caused by definitions are made to them to achieve goods trade in balance of payments terms.
Finnish Customs’ statistical service, tilastot@tulli.fi, +358 29 552 335.
Source: International trade in goods and services 2018, Statistics Finland
Inquiries: Tommi Kaatrasalo 029 551 3320, Miia Korhonen 029 551 3420, globalisaatio.tilastot@stat.fi
Director in charge: Jan Nokkala
Publication in pdf-format (278.7 kB)
- Tables
-
Tables in databases
Pick the data you need into tables, view the data as graphs, or download the data for your use.
Appendix tables
- Revisions in these statistics
-
- Revisions in these statistics (20.3.2020)
Updated 20.3.2020
Official Statistics of Finland (OSF):
International trade in goods and services [e-publication].
ISSN=2343-4244. 4th quarter 2019. Helsinki: Statistics Finland [referred: 16.4.2024].
Access method: http://www.stat.fi/til/tpulk/2019/04/tpulk_2019_04_2020-03-20_tie_001_en.html