

Published: 15 March 2019
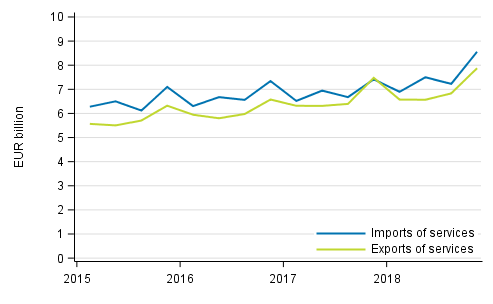
Service imports grew faster than service exports
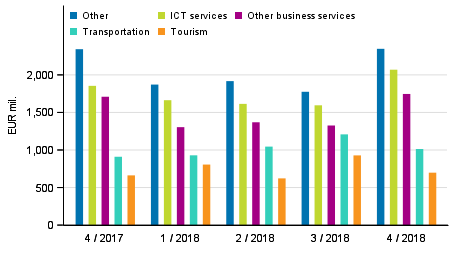
Service imports grew by 15 per cent in the last quarter of 2018 compared with the corresponding quarter of the previous year. Service exports grew by five per cent. The value of service imports was EUR 8.6 billion and that of exports EUR 7.9 billion. Other business services were imported most. Their imports also grew more than of any other service item. Exports grew most for the biggest export item of service exports, telecommunications, computer and information services. The data appear from Statistics Finland's statistics on international trade in goods and services, which are part of balance of payments .
Imports and exports of services
The combined exports of goods and services grew by five per cent and imports by 10 per cent in the last quarter of 2018 compared with the corresponding quarter in 2017. In balance of payments terms, goods exports grew by five per cent and goods imports by eight per cent. Goods exports recorded by Finnish Customs grew two percentage points more and imports by two percentage points less than recorded by the balance of payments.
The levels in customs terms and in balance of payments terms can differ, because goods trade in customs terms includes flows of goods where ownership does not change. In contrast, goods trade in balance of payments terms is based on change of ownership. In addition to the changes made to the customs data, goods trade in balance of payments terms includes sales and purchases from aboard to abroad.
According to preliminary data for 2018, the combined exports of goods and services grew by six per cent when comparing exports of the whole 2018 to exports of 2017. In turn, imports of goods and services grew by eight per cent in 2018.
Service imports grew more than exports also when examining the whole 2018.
According to preliminary data for 2018, service imports grew by 10 per cent compared to 2017. Service exports grew by five per cent. Both service exports and imports increased in 2018 due to the growth in international trade in the following items: other business services, transport services and manufacturing services.
In addition, service imports grew on account of purchases of telecommunications, computer and information services from abroad. EUR 0.6 billion more were used for purchasing these services than in 2017, which represents a growth of 20 per cent.
Imports of other business services were over EUR one billion higher in 2018 than one year previously. Imports of other business services grew EUR 0.4 billion more than their exports, but the percentage growth of both imports and exports in these items was the same: 14 per cent. Imports of other business services grew in 2018 in euros almost two times more than telecommunications, computer and information services and over two times more than transport services.
Exports of the most significant item of service exports, telecommunications, computer and information services, remained on level with the previous year in 2018.
Growing sales of telecommunications, computer and information services and transport services continued to show growth for service exports
Exports of telecommunications, computer and information services grew by 12 per cent in the last quarter of 2018. Exports of the second biggest item of service exports, other business services, did not grow in the corresponding period. This is explained by the exceptionally high level of exports in the comparison period, the last quarter of 2017, in the sub-item of other business services, research and development services.
Transport services were still the third biggest item of exports. Their exports grew by 11 per cent in the last quarter of 2018.
The 15 per cent growth in service imports in the last quarter of 2018 was boosted particularly by three service items: other business services, telecommunications, computer and information services, and transport services.
Imports of other business services grew by 30 per cent. Other business services include research and development services, technical, trade-related and other business services, and professional and management consulting services.
Imports of telecommunications, computer and information services grew by 28 per cent, but EUR 0.4 billion less than imports of other business services.
Exports of services by service item
One-third of services bought in Finland are exported to three countries.
In 2018, the most important service export countries for Finland were Sweden, the United States and Germany. Around one-third of Finland's total service exports were exported to these countries. The share of service exports to the United States was some 40 per cent in 2018. For Sweden and Germany, the shares of service exports in total exports were around one third.
Exports to Sweden and Germany thus follow the same structure as Finland's current exports of goods and services where the share of service exports is around one-third of total exports.
According to preliminary data, service exports to Germany grew by 16 per cent in 2018 from the previous year. Goods exports to Germany in balance of payments terms grew less: by nine per cent. Service exports to Sweden grew less in percentages than to Germany according to preliminary data for 2018. The growth to Sweden was four per cent, but exports of services there were EUR 1.3 billion higher than to Germany.
According to preliminary data, service exports appear to have picked up for the United States in the latter half of 2018, when they grew by 13 per cent compared to the corresponding period of the previous year. However, the growth for the whole year remained at three per cent. Goods exports to the United States grew less than service exports in the latter half of 2018: by seven per cent.
Correspondingly, imports from the United States grew in the two last quarters of 2018 compared to the corresponding period of 2017. During the period, service imports grew by 18 per cent and goods imports in balance of payments terms by as much as 28 per cent.
Imports from Russia growing
In addition to the United States, imports from Russia also grew for both goods and services. The growth was also faster for Russia in the latter half of 2018 than in the early part of the year. The growth in the whole 2018 for services was 15 per cent compared to the previous year, while in the latter part of the year the growth was 19 per cent.
Preliminary data indicate that goods imports from Russia in turn grew by 23 per cent in 2018. In the latter half of 2018, goods imports increased by 32 per cent.
Exports of services to Russia reflected the general growth in service exports in 2018. They grew by six per cent, or one percentage point more than service exports to the whole world.
Goods imports in balance of payments terms from the United Kingdom have remained on level with 2017 in 2018. However, preliminary data indicate that six per cent more services were imported from the United Kingdom. In turn, goods exports to the United Kingdom grew by 10 per cent in 2018, while five per cent less services were exported than in 2017.
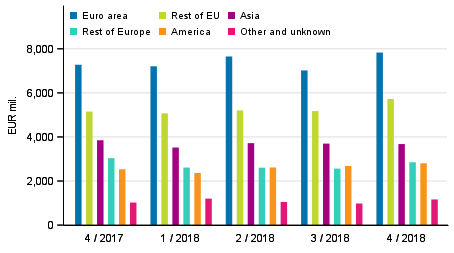
Exports of goods and services in balance of payments terms by area
Statistics on international trade
The statistics on international trade in goods and services are part of balance of payments . The statistics comprise breakdowns of goods and services on a more detailed level. The guidelines and recommendations of the Balance of Payments Manual (BPM6) applied to balance of payments are consistent with the European System of Accounts (ESA 2010). National Accounts are published on quarterly and annual levels . Finnish Customs publishes data on goods trade across borders. Goods trade published by Finnish Customs is used as source data for the statistics on international trade in goods and services. Removals and additions caused by definitions are made to them to achieve goods trade in balance of payments terms.
Finnish Customs’ statistical service, tilastot@tulli.fi, +358 29 552 335.
Source: International trade in goods and services 2018, Statistics Finland
Inquiries: Tommi Kaatrasalo 029 551 3320, Terhi Tulonen 029 551 3604, globalisaatio.tilastot@stat.fi
Director in charge: Ville Vertanen
Publication in pdf-format (271.7 kB)
- Tables
-
Tables in databases
Pick the data you need into tables, view the data as graphs, or download the data for your use.
Appendix tables
- Revisions in these statistics
-
- Revisions in these statistics (15.3.2019)
Updated 15.3.2019
Official Statistics of Finland (OSF):
International trade in goods and services [e-publication].
ISSN=2343-4244. 4th quarter 2018. Helsinki: Statistics Finland [referred: 18.4.2024].
Access method: http://www.stat.fi/til/tpulk/2018/04/tpulk_2018_04_2019-03-15_tie_001_en.html