

Published: 8 October 2010
New orders in manufacturing grew by just under one-quarter year-on-year in August
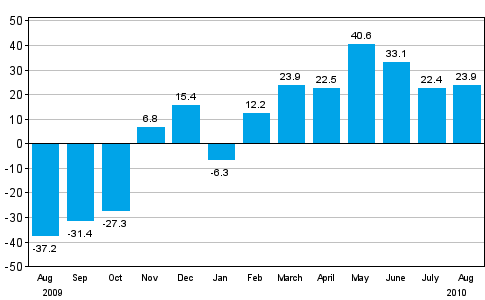
According to Statistics Finland, the value of new orders in manufacturing was 23.9 per cent higher in August 2010 than twelve months earlier. In the January to August period, new orders in manufacturing increased by 21.3 per cent year-on-year.
Change in new orders in manufacturing from corresponding month of the previous year (original series), % (TOL 2008)
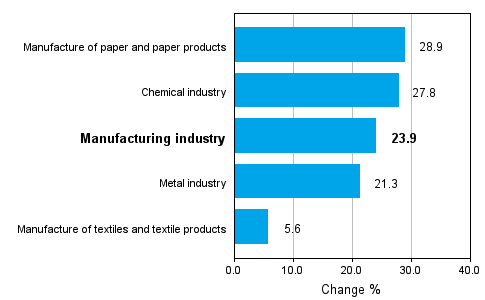
The development of new orders in manufacturing was in August much like the average for the early part of the year. As in the preceding months, the value of new orders rose in all the examined main industries. New orders grew by 28.9 per cent in the manufacture of paper, and paper and board products, by 27.8 per cent in the chemical industry, by 21.3 per cent in the metal industry and by 5.6 per cent in the textile industry. Despite the growth, in the most important main activity of metal industry the value of new orders was still fairly low so the growth is partly explained by the weak situation in the respective period of the comparison year.
These statistics should be examined bearing in mind that they typically show strong monthly fluctuations because even new orders of high value are not examined over extended time periods but for the statistical reference month only.
Change in new orders in manufacturing 08/2009-08/2010 (TOL 2008)
The index of new orders in manufacturing describes development in the value of new orders received by enterprises for commodities and services that are meant to be produced by establishments located in Finland. These statistics are based on non-probability sampling, in which the basic observation unit is an enterprise or a kind-of-activity unit. The sample comprises monthly approximately 400 to 430 enterprises or their kind-of-activity units. Index point figures and annual change percentages are published monthly for five industry categories. The time series start from January 2005 and their base year is 2005 (2005=100). A detailed description of the statistics and the calculation method are included in the quality description on the home page of the statistics.
Source: New orders in manufacturing 2010, August. Statistics Finland
Inquiries: Kari Rautio (09) 1734 2479, volyymi.indeksi@stat.fi
Director in charge: Hannele Orjala
Publication in pdf-format (243.4 kB)
Updated 8.10.2010
Statistics:
New orders in manufacturing [e-publication].
ISSN=1798-6737. August 2010. Helsinki: Statistics Finland [referred: 19.4.2024].
Access method: http://www.stat.fi/til/teul/2010/08/teul_2010_08_2010-10-08_tie_001_en.html