

Published: 17 December 2021
Households’ saving rate declined in the third quarter
Households’ saving rate fell in July to September from the previous quarter. Consumption expenditure grew more strongly than disposable income. Households’ investment rate remained on level with the previous quarter. The profit share of non-financial corporations also remained on level with the previous quarter. The investment rate of the non-financial corporations sector fell by 2.3 per cent from the previous quarter. The fall in the investment rate was caused by gross fixed capital formation or investments contracting while value added grew. These data derive from Statistics Finland’s quarterly sector accounts.
Key indicators for households and non-financial corporations, seasonally adjusted
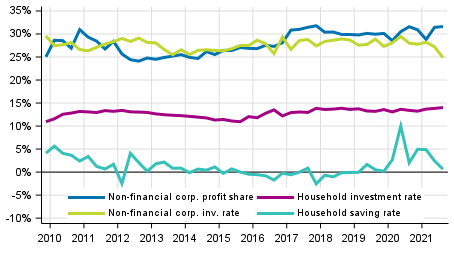
The key figures were calculated from seasonally adjusted time series. Sector accounts are calculated only at current prices. However, an indicator describing the development adjusted for price changes is calculated for households' adjusted disposable income. The profit share, saving rate and investment rate are calculated from net figures, from which consumption of capital is removed. Households do not include non-profit institutions serving households.
Households
Households' seasonally adjusted saving rate decreased clearly from the data of the previous quarter and stood at 0.6 per cent in July to September. The saving is derived by deducting consumption expenditure from disposable income. The saving is positive if households' disposable income is greater than households' consumption expenditure. The saving rate refers to the share of households’ savings in disposable income. In the third quarter of 2021, households’ disposable income grew slightly from the previous quarter, but as consumption expenditure grew significantly, already rising higher than the level prior to the pandemic, savings and thus the saving rate decreased clearly compared with the previous quarter.
Households' seasonally adjusted investment rate grew slightly from the previous quarter, being 14.0 per cent. The investment rate is the ratio of households' investments to disposable income. Most of households' investments are investments in dwellings. When households' investments grew slightly more than disposable income, the investment rate increased somewhat, but not significantly.
Compared with the corresponding quarter of the previous year, households' disposable income increased by good EUR one billion in the third quarter of 2021. The key components of disposable income on the income side are wages and salaries received, entrepreneurial and property income, and social benefits received. The biggest expense items are taxes paid and social contributions. In the third quarter of 2021, wages and salaries received grew by EUR 1.5 billion, entrepreneurial income and social benefits received remained roughly on level with the previous year, and property income received decreased slightly compared with the previous year’s figures. On the expense side, however, taxes paid did not grow much because tax refunds paid reduce tax revenue, but social contributions paid grew by good EUR one billion compared with the corresponding period of the previous year. The large increase in social security contributions paid was mainly due to the temporary reduction in employers’ pension contributions at the onset of the pandemic, and now the contributions are again on the same level as before.
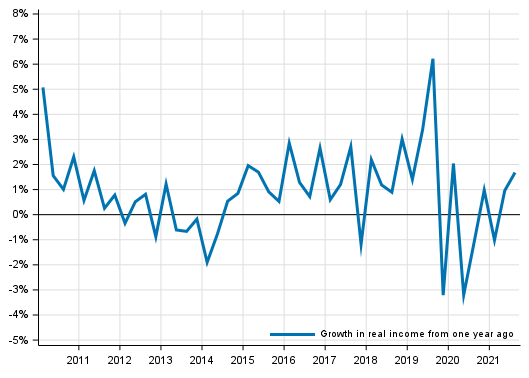
When individual services produced by the public sector and non-profit institutions, such as educational, health and social services, are added to disposable income, the concept of adjusted disposable income can be attained. Adjusted disposable income is the indicator recommended by the OECD for evaluating the economic well-being of households. In the third quarter of 2021, households’ adjusted disposable income grew at current prices by 3.7 per cent and adjusted for price changes by 1.7 per cent from the corresponding quarter of the year before. The indicator describing the development of adjusted disposable income adjusted for price changes can be found in Appendix table 3 of this publication.
Volume development of households’ adjusted disposable income
Compensation of employees paid by non-profit institutions serving households increased by as much as 5.6 per cent compared with the exceptionally low quarter of one year ago. Many associations in the fields of sports and culture have clearly recovered and are starting to operate at pre-pandemic levels.
In these statistics, the households sector only covers the actual households sector S14. Sector S15, non-profit institutions serving households, is calculated and published separately. The households sector in Eurostat’s publications also includes the data for sector S15. Another difference to Eurostat's publication is in how consumption of fixed capital is taken into account. Eurostat publishes investment and saving rates as gross figures, i.e. including consumption of fixed capital. Net data are used in these statistics, that is, when consumption of fixed capital is taken into account, saving and investment rates decrease.
Profit share of non-financial enterprises remained on level with the previous quarter
In the third quarter of 2021, the seasonally adjusted profit share of non-financial corporations remained on level with the previous quarter, at 31.6 per cent. The profit share refers to the share of the operating surplus in value added. The operating surplus is calculated by deducting from value added compensation of employees paid and other taxes on production and by adding to it received subsidies on production. In April to June, the relative growth in value added was clearly faster than the growth in compensation of employees. In July to September, both value added and compensation of employees continued to grow but the growth in compensation of employees was closer to the growth in value added. In July to September, the level of subsidies on production was still slightly higher than before the pandemic. However, compared to the previous quarter, the non-financial corporations sector received less subsidies on production. Due to the combined effect of these changes, the profit share did not change much.
The investment rate of non-financial corporations, or the proportion of fixed capital investments in value added decreased by 2.3 percentage points to 24.9 per cent. Seasonally adjusted investments grew in relative terms more slowly than value added.
Profits of financial and insurance corporations grew
Seasonally adjusted value added in financial and insurance corporations grew by 10.5 per cent from the previous year's corresponding quarter. Output went up by 13.1 per cent and intermediate consumption by 15.1 per cent. The operating surplus describing profits in the sector was EUR 0.6 billion in the third quarter and it grew by 18.2 per cent. Compensation of employees paid, in turn, grew by 6.1 percentage points from one year ago.
Property income and property expenditure in the sector fell from the respective quarter of the year before. The property income of financial and insurance corporations fell by 1.1 per cent, or by around EUR 30 billion. Property expenditure was 4.6 per cent, or around EUR 0.1 billion lower than in the corresponding quarter of the year before. Property items include dividends, interests and reinvested earnings.
Value added and operating surplus describe the income that is generated from providing financial services to the public. It does not include property income or holding gains of securities.
Financial position of general government improved from last year
Consolidated total general government revenue grew by EUR 2.0 billion, while consolidated total expenditure grew by EUR 0.3 billion from the previous year's corresponding quarter. The difference between revenue and expenditure, that is, the financial position of general government, was EUR 2.9 billion in deficit.
The statistics on quarterly sector accounts examine general government as a whole. More detailed information on quarterly sector accounts of general government can be found in the statistics on general government revenue and expenditure where the sub-sectors are specified: http://www.stat.fi/til/jtume/index_en.html
International trade increased in the third quarter of 2021
The value of exports of goods from Finland amounted to EUR 18.1 billion in the third quarter of 2021, which was 28.0 per cent more than in the corresponding quarter one year ago. The value of exports of services was EUR 6.7 billion, which was 19.1 per cent more than one year ago. The value of imports of goods to Finland amounted to EUR 17.3 billion, which was 22.2 per cent more than one year ago. The value of imports of services amounted to EUR 7.3 billion, which was 15.1 per cent more than one year ago. The balance of goods and services showed a surplus of EUR 0.2 billion in the third quarter of 2021.
Property income received from abroad was EUR 2.3 billion higher than property income paid abroad. Property income includes dividends, interests and reinvested earnings. Current transfers paid abroad from Finland were EUR 0.6 billion higher than current transfers paid from abroad to Finland. The most significant current transfer item is the GNI payment paid by the state to the EU. The current account was EUR 2.0 billion in surplus in the third quarter of 2021.
Data and methods used
The quarterly data become revised as source data are updated. The biggest revisions take place for the last two to three years, because the data in the annual accounts are still preliminary. The data in this publication are based on the data sources available by 6 December 2021. The data for 1999 to 2020 mainly correspond with the annual sector accounts of the National Accounts.
The saving rate, profit share and investment rate in the quarterly publication of sector accounts are net amounts, i.e. consumption of fixed capital has been removed from the figures. In addition, financial accounts data on the stock of households’ loan debts are used in calculating households’ indebtedness rate. The indebtedness rate is presented adjusted and non-adjusted for seasonal variation in the database table of sector accounts. The indebtedness rate from figures non-adjusted for seasonal variation is published by financial accounts. The key indicators in these statistics were calculated as follows:
Households' saving rate = B8N / (B6N+D8R)
Households' investment rate = P51K / (B6N+D8R)
Households' indebtedness rate = F4 / B6N
Profit share of non-financial corporations = B2N / B1NPH
Investment rate of non-financial corporations = P51K / B1NPH
The indicator of households' adjusted disposable income is calculated using the price data of the statistics on quarterly national accounts, with which the components of adjusted disposable income are deflated. Households' disposable income is deflated with the implicit price index of household consumption expenditure. Price data are also available for the consumption of non-profit institutions serving households. As a methodological shortcoming, general government individual consumption expenditure has to be deflated with the total general government consumption expenditure for lack of more accurate data. The volume time series was formed with the annual overlap method.
Source: Sector accounts, Statistics Finland
Inquiries: Nata Kivari 029 551 3361, Katri Soinne 029 551 2778, kansantalous.suhdanteet@stat.fi
Head of Department in charge: Katri Kaaja
Publication in pdf-format (461.6 kB)
- Tables
-
Tables in databases
Pick the data you need into tables, view the data as graphs, or download the data for your use.
Appendix tables
- Figures
-
- Appendix figure 1. Households saving rate (17.12.2021)
- Appendix figure 2. Households investment rate (17.12.2021)
- Appendix figure 3. Non - financial corporations profit share (17.12.2021)
- Appendix figure 4. Non - financial corporations investment rate (17.12.2021)
- Revisions in these statistics
-
- Revisions in these statistics (17.12.2021)
Updated 17.12.2021
Official Statistics of Finland (OSF):
Quarterly sector accounts [e-publication].
ISSN=2243-4992. 3rd quarter 2021. Helsinki: Statistics Finland [referred: 19.4.2024].
Access method: http://www.stat.fi/til/sekn/2021/03/sekn_2021_03_2021-12-17_tie_001_en.html