

Published: 21 December 2018
Growth of household’s net financial assets continued in the third quarter of 2018
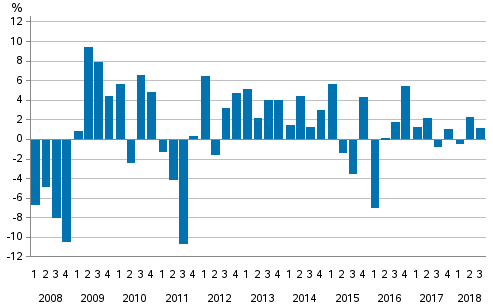
Households' financial assets grew by EUR 2.7 billion during the third quarter of 2018. At the end of the quarter, households had financial assets, such as deposits, shares and mutual fund shares, to the value of EUR 310.2 billion. Over the same period, households had EUR 166.6 billion in debt, which was EUR 1.1 billion up from the previous quarter. Households’ net financial assets grew in July to September by EUR 1.7 billion to EUR 143.7 billion. Net financial assets refer to the difference between financial assets and liabilities. These data derive from Statistics Finland’s financial accounts statistics.
Change from the previous quarter in households’ net financial assets
Holding gains raised households’ financial assets
During the third quarter of 2018, households increased their net investments in financial assets by EUR 0.7 billion. EUR 1.1 billion more assets flowed to cash and transferable deposits on net. Investments in mutual fund shares also grew on net. In turn, investments in quoted shares, time deposits and debt securities decreased on net.
Most of the rise in the total level of households’ financial assets, EUR 2.1 billion, was, however, due to holding gains, that is, the value increase of investments. The favourable development in prices of quoted shares raised households’ assets by EUR 1.1 billion. The value development of unquoted shares and equity and mutual fund shares was also positive.
Households’ indebtedness ratio increased
Households’ loan debts increased by EUR 1.8 billion in the third quarter of 2018. Loan debts amounted to EUR 152.0 billion at the end of the quarter. Households' indebtedness ratio rose by 0.6 percentage points from the previous quarter to 128.1 per cent. Households' indebtedness ratio is calculated as the ratio of their loan debts at the end of a quarter to their total disposable income during the preceding four quarters.
Non-financial corporations’ debt financing decreased slightly
Non-financial corporations’ debt financing declined by EUR 0.3 billion during the third quarter of 2018 to EUR 248.2 billion. Debt financing refers to non-financial corporations’ loan debts and commercial papers and other debt securities issued by non-financial corporations. Non-financial corporations’ financing in the form of debt securities decreased to EUR 31.1 billion, a drop of EUR 0.4 billion from the level at the end of June. Non-financial corporations' loan debts grew by EUR 0.1 billion to EUR 217.1 billion. Here, the non-financial corporations sector does not include housing companies or other housing corporations.
Source: Financial accounts, Statistics Finland
Inquiries: Henna Laasonen 029 551 3303, Tuomas Koivisto 029 551 3329, rahoitus.tilinpito@stat.fi
Director in charge: Ville Vertanen
Publication in pdf-format (248.4 kB)
- Tables
-
Tables in databases
Pick the data you need into tables, view the data as graphs, or download the data for your use.
Appendix tables
- Figures
- Revisions in these statistics
-
- Revisions in these statistics (21.12.2018)
Updated 21.12.2018
Official Statistics of Finland (OSF):
Financial accounts [e-publication].
ISSN=1458-8145. 3rd quarter 2018. Helsinki: Statistics Finland [referred: 19.4.2024].
Access method: http://www.stat.fi/til/rtp/2018//03/rtp_2018_03_2018-12-21_tie_001_en.html