

Published: 13 November 2020
Turnover and output in services fell in September
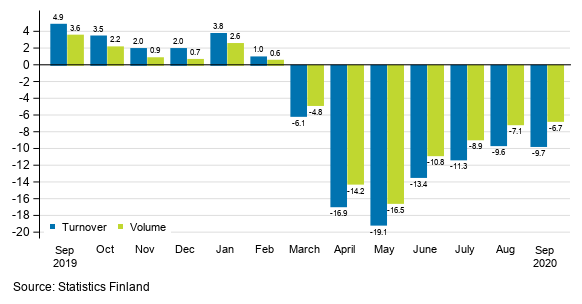
Working day adjusted turnover in service industries fell by 9.7 per cent in September 2020 from September 2019. Service output or volume, from which the impact of prices has been eliminated, fell by 6.7 per cent over the same period. In this year's August, turnover went down by 9.6 per cent, while volume contracted correspondingly by 7.1 per cent. Services are here examined exclusive of trade.
Annual change in working day adjusted turnover and volume of service industries, %
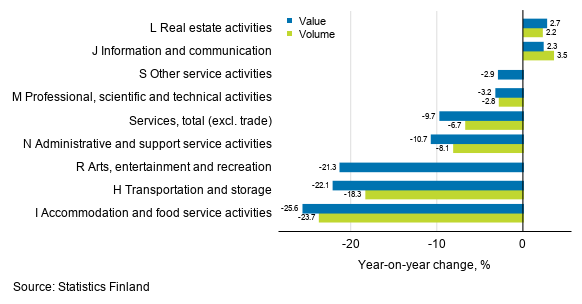
In September 2020, the weakest development among the main service industries was recorded in accommodation and food service activities, where working day adjusted turnover fell by 25.6 per cent from September 2019. Over the same period, the volume also went down, being 23.7 per cent lower than in September 2019.
In the biggest service industry in terms of turnover, transportation and storage, working day adjusted turnover decreased by 22.1 per cent from September 2019. The volume of transportation and storage was 18.3 per cent lower in September 2020 than one year earlier. Turnover in arts, entertainment and recreation also went down (-21.3%).
Administrative and support services activities also remained above the average fall in turnover in service industries, as working day adjusted turnover decreased by 10.7 per cent in September 2020 from one year ago. Correspondingly, the 8.1 per cent drop in the volume of the industry was weaker than the average development in the volume of service industries. Among the main service industries, professional, scientific and technical activities (-3.2%) and other service activities (-2.9%) also went down. The volume of professional, scientific and technical activities decreased by 2.8 per cent in September 2020.
In September 2020, the most positive development in service industries was seen in real estate activities, where working day adjusted turnover went up by 2.7 per cent from September 2019. The industry’s volume went up by 2.2 per cent in the corresponding period. In information and communication, working day adjusted turnover also developed positively in September 2020, reaching a growth of 2.3 per cent from one year earlier. The volume of the industry increased by 3.5 per cent over the same period.
Annual change in working day adjusted turnover and volume of service industries, September 2020, % (TOL 2008)
Turnover and output grew from the previous month
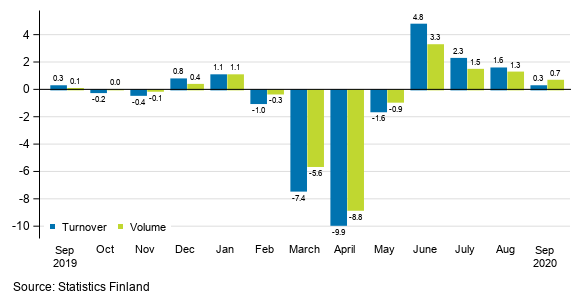
Seasonally adjusted turnover in service industries increased in September 2020 by 0.3 per cent compared to August. The output of services, from which the impact of prices has been eliminated, grew by 0.7 per cent over the same period. One month earlier, turnover grew by 1.6 per cent from July 2020. At that time, volume grew by 1.3 per cent.
Change in seasonally adjusted turnover and volume from the previous month of service industries, %
The data for the latest month are preliminary and they may become significantly revised particularly on more detailed industry levels in coming months. The volume of service industries is calculated by eliminating the effect of price changes from the turnover index.
The factors caused by the variation in the number of weekdays are taken into account in adjustment for working days. This means taking into consideration the lengths of months, different weekdays and holidays. In addition, seasonal variation is eliminated from seasonally adjusted series, on account of which it makes sense to compare observations of two successive months as well.
Source: Turnover of service industries, Statistics Finland
Inquiries: Aki Niskanen 029 551 2657, Katja Liukkonen 029 551 3515, Tony Valve 029 551 3453, palvelut.suhdanne@stat.fi
Head of Department in charge: Mari Yl�-Jarkko
Publication in pdf-format (412.1 kB)
- Tables
-
Tables in databases
Pick the data you need into tables, view the data as graphs, or download the data for your use.
Appendix tables
- Figures
-
- Appendix figure 1. Turnover and volume of service industries, trend series (13.11.2020)
- Appendix figure 2. Turnover and volume of transportation and storage, trend series (13.11.2020)
- Appendix figure 3. Turnover and volume of information and communication, trend series (13.11.2020)
- Appendix figure 4. Turnover and volume of real estate activities, trend series (13.11.2020)
- Appendix figure 5. Turnover and volume of professional, scientific and technical activities, trend series (13.11.2020)
- Appendix figure 6. Turnover and volume of administrative and support service activities, trend series (13.11.2020)
- Revisions in these statistics
-
- Revisions in these statistics (13.11.2020)
Updated 13.11.2020
Official Statistics of Finland (OSF):
Turnover of service industries [e-publication].
ISSN=1799-0998. September 2020. Helsinki: Statistics Finland [referred: 18.4.2024].
Access method: http://www.stat.fi/til/plv/2020/09/plv_2020_09_2020-11-13_tie_001_en.html