

Published: 22 September 2017
Current account deficit decreased, net international investment position weakened
The current account deficit decreased in the second quarter as net exports increased. The surplus of the trade account in balance of payments terms grew clearly and the deficit of the service account decreased as exports grew more than imports. The net international investment position weakened as the liabilities of the non-financial corporations sector increased. The data appear from Statistics Finland's statistics on balance of payments and international investment position.
Current account and trade account
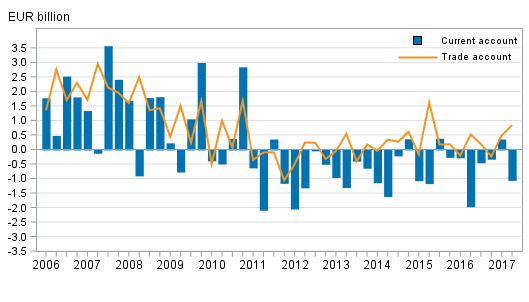
Current account in the second quarter
The current account was EUR 1.0 billion in deficit in the second quarter of 2017. The deficit decreased by EUR 0.9 billion from the corresponding quarter last year. In balance of payments terms, goods exports grew more than goods imports. Service exports also grew clearly.
In balance of payments terms, the trade account was EUR 0.8 billion in surplus. In the corresponding quarter of the previous year, the trade account was EUR 0.5 billion in surplus. In the second quarter, goods exports in balance of payments terms amounted to EUR 15.5 billion and grew by 13 per cent from the corresponding period in 2016. Goods imports increased to EUR 14.7 billion, rising by 11 per cent year-on-year. Goods exports in balance of payments terms have grown by 16 per cent in January to June compared to the corresponding period last year.
The service account showed a deficit of EUR 0.5 billion in the second quarter. In the second quarter of 2016, the deficit stood at EUR 0.9 billion. Service exports, EUR 6.2 billion, grew by nine per cent and service imports by two per cent. In January to June, service exports grew by five per cent.
The primary income account was EUR 0.9 billion in deficit in the second quarter, which is mainly explained by the deficit of investment income. The primary income account includes investment income like interests and dividends. The secondary income account was EUR 0.5 billion in deficit.
Import and export figures in balance of payments terms by service item and area can be found in the statistics on international trade in goods and services . Decreases and increases made to the Finnish Customs figures, which result in goods trade in balance of payments terms, are also broken down in the statistics on international trade in goods and services.
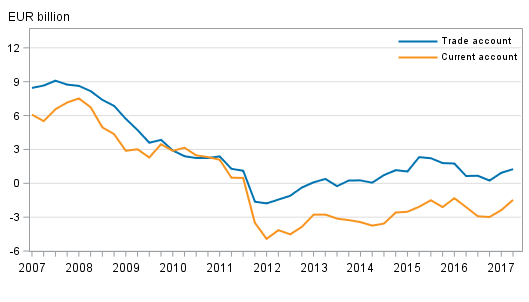
Finland’s current account and trade account, 12 –month moving sum
Financial account and net international investment position
Net international investment position weakened
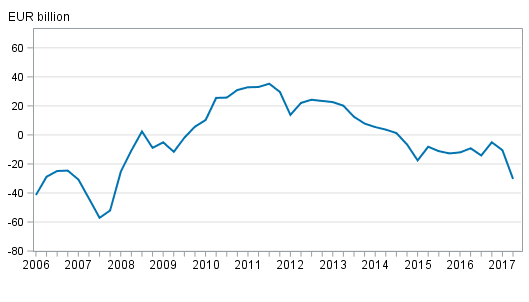
At the end of the second quarter of 2017, Finland had EUR 605.0 billion in foreign assets on gross and EUR 635.4 billion in foreign liabilities on gross. Thus, the net international investment position stood at EUR -30.3 billion. The net international investment position weakened compared with the end of the previous quarter, when the net international investment position was EUR -10.5 billion. Examined by sector, the net international investment position was weakened most by a decrease in the net international investment position of the non-financial corporations sector, from EUR -67.6 billion to EUR -86.0 billion.
Compared with previously released data, Finland’s net international investment position has weakened throughout the revised time series, starting from the first quarter of 2015. The data revision is mainly explained by a downward revision in net investment position of portfolio investments.
Finland’s net international investment position quarterly
Capital flowed to Finland in almost all investment categories
In the second quarter of 2017, net capital inflow to Finland amounted to EUR 15,0 billion. Net capital inflow was mostly in the form of direct investments, EUR 9.8 billion. Net outward capital flow was only in the form of other investments, that is, for example, as extra-group loans, deposits and trade credits, EUR 0.5 billion on net.
At the end of the second quarter of 2017, international direct investment assets on gross stood at EUR 148.0 billion and the corresponding liabilities at EUR 114.2 billion. The net international investment position of direct investments was thus positive at the end of the second quarter as there were EUR 33.8 billion more assets than liabilities. The net international investment position of direct investments weakened in the second quarter when assets from foreign direct investments fell and liabilities grew but it was still EUR 1.0 billion higher than one year ago.
Assets from foreign direct investments were increased by EUR 0.3 billion on net during the second quarter. Gross assets from direct investments fell, however, because other valuation changes in assets amounted to EUR -3.0 billion in the second quarter. Liabilities from direct investments were increased by EUR 10.0 billion on net, and the increase in liabilities was directed primarily at intra-group loans.
Outward capital flow on net in the form of portfolio investment assets amounted to EUR 0.3 billion in the second quarter of 2017. By contrast, the investment stock contracted due to exchange rate and price changes, EUR 4.0 billion in total. At the end of the second quarter of 2017, outward portfolio investment assets stood at EUR 298.5 billion, of which EUR 166.0 billion were investments in equity and investment fund shares, and EUR 132.5 billion in bonds and money market instruments. Even though Finland’s international portfolio investment assets have declined during the first two quarters of 2017, the investment stock is still EUR 2.8 billion higher than one year ago.
At the end of the second quarter, international portfolio investment liabilities stood at EUR 331.2 billion, of which EUR 129.8 billion were investments in equity and investment fund shares, and EUR 201.3 billion in bonds and money market instruments. In the second quarter, foreign portfolio investments to Finland increased by EUR 4.5 billion on net. A total of EUR 3.7 billion were invested in equity and investment fund shares on net and EUR 0.7 billion in debt securities.
In the second quarter, financial transactions decreased other investment assets by EUR 19.8 billion on net. Investments were also withdrawn from other investment liabilities, EUR 20.4 billion on net. At the end of the second quarter, assets as other investments amounted to EUR 127.4 billion and liabilities to EUR 170.8 billion.
At the end of the second quarter of 2017, Finland had EUR 2.4 billion in derivative-related net assets, which is EUR 1.9 billion less than at the end of the first quarter. Both derivative-related assets and liabilities have declined considerably compared to one year ago mainly as a result of international company restructurings. Assets have contracted from EUR 108.3 billion to EUR 21.6 billion and liabilities from EUR 103.5 billion to EUR 19.2 billion.
Source: Balance of payments and international investment position, Statistics Finland
Inquiries: Tapio Kuusisto 029 551 3318, Saana Ranta-Ruona 029 551 3375, balanceofpayments@stat.fi.
Director in charge: Ville Vertanen
Publication in pdf-format (313.1 kB)
- Tables
-
Tables in databases
Pick the data you need into tables, view the data as graphs, or download the data for your use.
Appendix tables
Updated 22.9.2017
Official Statistics of Finland (OSF):
Balance of payments and international investment position [e-publication].
ISSN=2342-348X. 2nd quarter 2017. Helsinki: Statistics Finland [referred: 19.4.2024].
Access method: http://www.stat.fi/til/mata/2017/42/mata_2017_42_2017-09-22_tie_001_en.html