

Published: 15 June 2015
Current account in deficit, net capital flowed in the first quarter of 2015
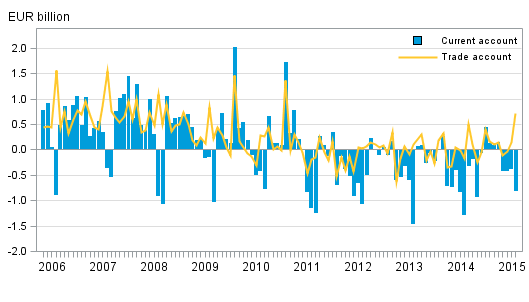
In balance of payment terms, the trade account was in balance in the first quarter. Exports of goods made a downturn as goods exports to Russia declined strongly. Service exports remained on last year's level. In April, the trade account was pushed into surplus as exports increased slightly and imports decreased further. On the financial account side there was net capital inflow, mainly in form of direct investments.
Finland’s current account and trade account
Current account in the first quarter
The current account was EUR 1.2 billion in deficit in the first quarter of 2015. The deficit was generated from the service, primary and secondary income accounts. The trade account was in balance.
The total value of goods exports was EUR 12.9 billion in the first quarter of 2015. Goods exports to Russia decreased by 34 per cent compared with the first quarter of 2014, which pushed total exports to a 2.5 per cent decline. Excluding Russia, goods exports in the first quarter remained on level with the previous year.
Service exports amounted to EUR 4.8 billion in the first quarter as the telecommunications, computer, and information services item grew clearly to EUR 1.9 billion. In most service items the year-on-year changes were small and service exports remained on last year's level. Service exports were depressed by the decrease in consumption by Russian visitors in Finland. Foreign tourists' consumption in Finland is recorded as service exports and it amounted to EUR 0.6 billion in the first quarter.
The value of goods imports in balance of payment terms, EUR 12.9 billion, decreased by 4.7 per cent in the first quarter. Goods imports from Russia declined by 23 per cent. Excluding Russia, goods imports in the first quarter decreased by around one per cent from the previous year. Service imports, EUR 5.3 billion, declined by good one per cent. The net effect of services derived from the difference between service exports and imports was EUR 0.4 billion in deficit.
The primary income account was EUR 0.2 billion in deficit. The deficit was generated from investment income. Investment income from Finland amounted to EUR 3.5 billion and to Finland from abroad to EUR 3.2 billion. Investment income includes such as interests and dividends. The secondary income account was EUR 0.6 billion in deficit. The secondary income account includes payments to international organisations.
Current account in April 2015
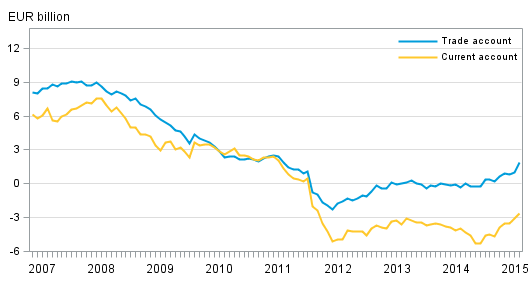
The current account was EUR 0.8 billion in deficit in April despite the trade account being in surplus. One year earlier, in April 2014, the current account showed a deficit of EUR 1.3 billion. The 12-month moving total of the current account was EUR 2.6 billion in deficit.
The deficit in the current account was particularly formed from the primary income account that was EUR 1.3 billion in deficit. The services account and the secondary income account were also in deficit. The EUR 0.7 billion surplus in the trade account was explained by a decrease in imports. The value of goods imports in balance of payment terms was EUR 4.1 billion in April and it decreased by 17 per cent from April 2014. Goods exports, EUR 4.8 billion, increased by one per cent.
Finland’s current account and trade account, 12 –month moving sum
Financial account and international investment position
In the first quarter of 2015 net capital inflow to Finland amounted to EUR 5.0 billion. The main source of inward capital flow on net was direct investments, EUR 9.5 billion. Correspondingly, outward capital flow on net was mainly in the form of other investments (loans, deposits and trade credits), totalling EUR 3.5 billion.
At the end of March 2015, Finland had EUR 803.3 billion in foreign assets and EUR 811.0 billion in foreign liabilities. Finland's net international investment position was negative EUR 7.7 billion. Most net debt was found in the other investments item, EUR 37.7 billion. In the first quarter of 2015, the net investment position was depressed by changes in exchange rates and other valuation changes, EUR 2.1 billion, as well as price changes, EUR 1.4 billion.
Table 1. External assets and liabilities by investment type in 2015 Q1, EUR billion
| Opening positiion 31.12.2014 | Financial transactions 2015 Q1 | Price changes 2015 Q1 | Changes in the exchange rates and valuation adjustments 2015 Q1 | Closing position 31.3.2015 | |
| Financial account | 0.8 | -5.0 | -1.4 | -2.1 | -7.7 |
| Assets | 723.6 | -2.8 | 66.7 | 15.7 | 803.3 |
| Liabilities | 722.8 | 2.2 | 68.2 | 17.8 | 811.0 |
| Direct investment | 25.9 | -9.5 | 1.1 | -2.5 | 15.0 |
| Assets | 135.5 | -0.8 | 1.7 | 2.8 | 139.1 |
| Liabilities | 109.6 | 8.7 | 0.6 | 5.3 | 124.2 |
| Portfolio investment | -2.7 | 3.0 | -6.2 | 2.7 | -3.3 |
| Assets | 284.0 | 0.9 | 10.2 | 9.4 | 304.5 |
| Liabilities | 286.8 | -2.1 | 16.4 | 6.7 | 307.8 |
| Other investment | -38.6 | 3.5 | 0.0 | -2.6 | -37.7 |
| Assets | 166.1 | 25.9 | 0.0 | 4.7 | 196.6 |
| Liabilities | 204.7 | 22.3 | 0.0 | 7.3 | 234.3 |
| Financial derivatives | 7.5 | -1.9 | 3.5 | -0.4 | 8.7 |
| Reserve assets | 8.8 | -0.1 | 0.2 | 0.7 | 9.6 |
Securities
In the first quarter of 2015, foreign investors dissolved their portfolio investments in Finland for a total of EUR 2.1 billion. Investments in Finnish equity and mutual fund shares grew by EUR 1.4 billion but investments in debt securities decreased by EUR 3.5 billion. At the end of March 2015, Finland's portfolio investment liabilities stood at EUR 307.8 billion, of which EUR 105.0 billion were investments in shares and mutual fund shares, and EUR 202.8 billion in bonds and money market instruments. Finland's portfolio investment liabilities also grew as the prices of Finnish shares increased during the first quarter.
Finland's portfolio investment assets increased by EUR 0.9 million. Capital flow to foreign securities was EUR 5.5 billion, while EUR 4.6 billion in equity and mutual fund shares were dissolved. In debt securities, investments in money market instruments increased by EUR 1.9 billion of which a majority was invested by other monetary financial institutions. A total of EUR 3.6 billion was invested in bonds. The biggest investors were insurance corporations and non-financial corporations.
At the end of March 2015, Finland's portfolio investment assets stood at EUR 304.5 billion, of which EUR 151.5 billion were investments in shares and mutual fund shares, and EUR 153.0 billion in bonds and money market instruments.
Direct investments
During the first quarter of 2015, EUR 8.7 billion in capital flowed to Finland as direct investments, while direct investment made from Finland to foreign countries decreased by EUR 0.8 billion. Direct investments include both equity and debt-based investments within a group. At the start of 2015, investments from abroad to Finland mainly consisted of debt-based items.
At the end of March 2015, Finland had EUR 139.1 billion in foreign assets and EUR 124.2 billion in foreign liabilities as direct investments. Despite the increase in direct investment liabilities, the net capital stock remained positive at the end of the first quarter of 2015.
Other investments
EUR 22.3 billion in capital flowed to Finland as other investments during the first quarter of 2015. At the end of March 2015, Finland had foreign liabilities in the form of other investments in the amount of EUR 234.3 billion. EUR 25.9 billion in capital flowed abroad from Finland as other investments. At the end of March 2015, Finland had foreign assets in the form of other investments in the amount of EUR 196.6 billion.
Financial derivatives
At the end of March 2015, Finland had EUR 8.7 billion derivative-related net assets. Derivative-related assets and liabilities have been growing since the beginning of 2014 but due to faster growth in assets, the net position has improved slightly. At the end of March 2014, net assets in the form of derivatives stood at EUR 6.3 billion.
April 2015
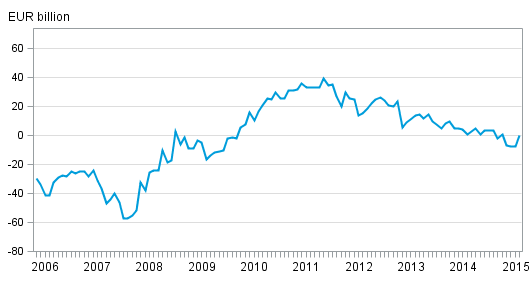
In April, the inward capital flow on net to Finland was EUR 2.5 billion. The main source of inward capital flow was other investments, EUR 1.1 billion. Direct investment was EUR 0.3 billion and portfolio investment was also EUR 0.3 billion inward on net. Finland's net investment position was slightly positive at the end of April 2015 as foreign liabilities amounted to a little under EUR 771.6 billion and assets to slightly over EUR 771.6 billion. Finland's net investment position improved compared to the situation at the end of March 2015 as the net investment position related to securities turned positive.
The data for May 2015 will be published on 10 July 2015.
Finland’s monthly international investment position
Source: Balance of payments and international investment position, Statistics Finland
Inquiries: Mira Malhotra 029 551 3411, Tapio Kuusisto 029 551 3318, balanceofpayments@stat.fi.
Director in charge: Mari Yl�-Jarkko
Publication in pdf-format (286.8 kB)
- Tables
-
Tables in databases
Pick the data you need into tables, view the data as graphs, or download the data for your use.
Appendix tables
Updated 15.6.2015
Official Statistics of Finland (OSF):
Balance of payments and international investment position [e-publication].
ISSN=2342-348X. April 2015. Helsinki: Statistics Finland [referred: 20.4.2024].
Access method: http://www.stat.fi/til/mata/2015/04/mata_2015_04_2015-06-15_tie_001_en.html