

Published: 4 June 2021
A total of 35,627 candidates in Municipal elections 2021
Altogether 35,627 candidates were nominated for the 2021 Municipal elections, which is 2,009 (5.6 per cent) more than in the previous Municipal elections. Nineteen of the registered parties nominated candidates, while the number of candidates nominated by constituency associations was 1,126. Of the candidates, 21,480 are men and 14,147 women. Of the candidates nominated, 176 are current Members of Parliament and 6,520 are current municipal councillors. Of the parties, the most candidates were nominated by the Centre Party of Finland, 6,871 candidates and the least candidates were nominated by the Citizens’ Party, two candidates. The data are based on Statistics Finland's statistics on the nomination of candidates for the Municipal elections 2021.
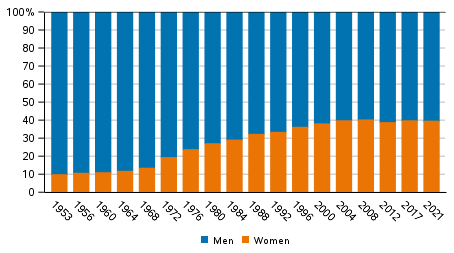
Women's and men’s proportions of candidates in Municipal elections 1953–2021
In Municipal elections, candidates can be nominated by registered political parties and constituency associations established by persons entitled to vote. Parties may form electoral alliances and constituency associations may form joint lists. Each party or electoral alliance may nominate at most 1.5 times the number of candidates as the number of councillors elected in the municipality. Of all candidates, 95.6 per cent were nominated by the current parliamentary parties. Of the candidates, 1.2 per cent were nominated by parties that do not have MPs in the present Parliament. Of such parties, the most candidates were nominated by the Crystal Party (96 candidates) and the least by the Citizens’ Party (2 candidates). Of the candidates, 3.2 per cent were nominated by constituency associations.
A majority of the candidates in the Municipal elections have always been men. In the elections 2021, altogether 21,480 of the candidates are men and 14,147 women. Women’s proportion of candidates is thus 39.7 per cent, which is 0.2 percentage points lower than in the 2017 Municipal elections.
Of the parliamentary party candidates, the proportion of female candidates is smallest for the Finns Party (21.5 per cent) and biggest for the Green League (60.0 per cent). Among all parties that nominated more than five candidates, the proportion of female candidates is highest in the Feminist Party (81.8 per cent) and lowest in the Liberal Party (6.9 per cent). Both of the candidates nominated by the Citizens' Party are men. Men account for 60.3 per cent of all parliamentary parties’ candidates. In parties and constituency associations from which no MPs were elected to the present Parliament, men's share of candidates is 59.8 per cent.
Share of men and women among candidates by party and age in Municipal elections 2021, parliamentary parties (%)
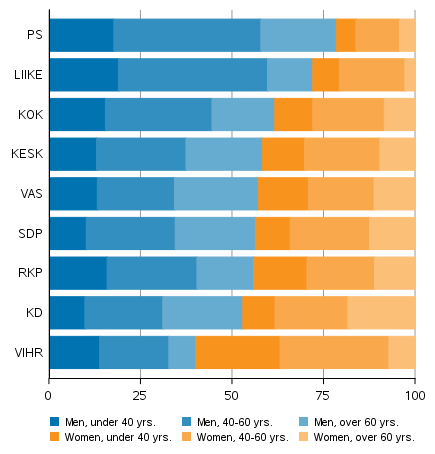
The average age of all candidates is 50.0 years, that of male candidates is 51.0 and that of female ones 48.3. Of all candidates, 26,721 are aged 40 or over. Of the candidates, 951 are aged 75 or over and 1,724 are aged 25 or younger.
Share of men and women among candidates by party and age in Municipal elections 2021, other parties and constituency associations (%)
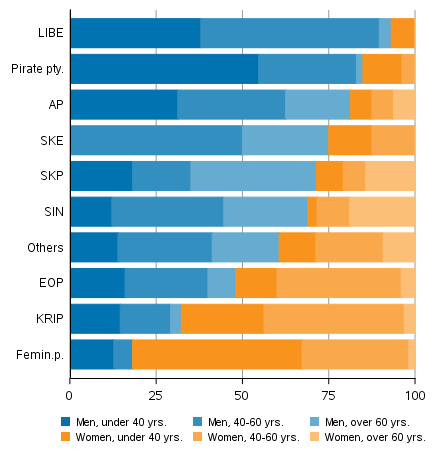
Among the parliamentary parties, the Swedish People’s Party has the most candidates aged under 25 (9.6 per cent) and the Christian Democrats have the least (3.2 per cent). In relative terms, the Feminist Party has the most candidates aged at most 25 (10.9 per cent). In relative terms, the Christian Democrats have the most candidates aged 65 or over (27.8 per cent) and Movement Now has the least (7.2 per cent). In relative terms, the Communist Party of Finland has the most candidates aged at least 65 (48.1 per cent). The age of the candidate is the age on the day of the election.
Table 1. Background analysis of candidates by party in the Municipal elections 2021
| Memb. of Parl. (%) |
Counc. in municipal councils (%) |
Average age |
Finn. or Sami speakers (%) |
Swedish speakers (%) |
Other lang. speakers (%) |
Employed (%) |
Unemployed (%) |
In inactive pop. (%) |
Avg. income |
|
| Candidates total |
0.5 | 18.3 | 50.0 | 91.9 | 5.4 | 2.7 | 69.9 | 6.0 | 24.2 | 28,400 |
| SDP | 0.7 | 22.2 | 52.2 | 93.5 | 3.7 | 2.8 | 69.5 | 5.5 | 25.1 | 28,700 |
| PS | 0.6 | 10.1 | 49.9 | 97.7 | 0.9 | 1.4 | 63.1 | 10.7 | 26.2 | 25,400 |
| KOK | 0.5 | 18.3 | 49.1 | 95.8 | 1.7 | 2.5 | 76.1 | 3.3 | 20.6 | 34,000 |
| KESK | 0.4 | 27.2 | 50.4 | 97.8 | 0.3 | 1.8 | 75.0 | 3.4 | 21.7 | 30,000 |
| VIHR | 0.6 | 13.2 | 44.6 | 92.5 | 2.4 | 5.1 | 74.5 | 6.7 | 18.9 | 28,700 |
| VAS | 0.5 | 16.3 | 50.7 | 95.0 | 1.8 | 3.2 | 61.5 | 8.0 | 30.5 | 25,100 |
| RKP | 0.6 | 24.1 | 48.1 | 9.3 | 86.0 | 4.7 | 75.6 | 3.2 | 21.2 | 31,500 |
| KD | 0.3 | 12.2 | 53.9 | 87.8 | 8.6 | 3.6 | 61.2 | 4.9 | 33.9 | 25,800 |
| LIIKE | 0.2 | 3.4 | 47.1 | 94.0 | 4.1 | 1.9 | 76.8 | 8.5 | 14.7 | 29,000 |
| LIBE | - | - | 40.8 | 93.1 | 3.4 | 3.4 | 62.1 | 10.3 | 27.6 | 19,200 |
| Pirate pty. | - | - | 36.9 | 90.6 | 1.9 | 7.5 | 50.9 | 20.8 | 28.3 | 18,800 |
| EOP | - | - | 45.9 | 96.0 | - | 4.0 | 52.0 | 28.0 | 20.0 | 18,200 |
| Femin.p. | - | 1.8 | 36.5 | 89.1 | 1.8 | 9.1 | 63.6 | 7.3 | 29.1 | 23,300 |
| SIN | - | 16.2 | 56.2 | 100.0 | - | - | 44.6 | 16.2 | 39.2 | 21,700 |
| SKE | - | - | 52.0 | 100.0 | - | - | 25.0 | 12.5 | 62.5 | 17,700 |
| AP | - | - | 44.7 | 87.5 | 6.3 | 6.3 | 56.3 | 6.3 | 37.5 | 20,300 |
| SKP | - | 2.6 | 56.2 | 96.1 | 1.3 | 2.6 | 24.7 | 11.7 | 63.6 | 18,200 |
| KRIP | - | 1.0 | 43.6 | 93.8 | 3.1 | 3.1 | 66.7 | 13.5 | 19.8 | 22,300 |
| Others | 0.1 | 20.7 | 50.3 | 93.7 | 3.5 | 2.8 | 67.2 | 7.1 | 25.7 | 27,000 |
Of the candidates 18.3 per cent are current municipal councillors. Among the parliamentary parties, of Centre Party candidates the most are councillors in relative terms (27.2 per cent) and of the Movement Now candidates the least (3.4 per cent).
Of the candidates, 91.9 per cent are Finnish or Sami speakers, 5.4 per cent are Swedish speakers and 2.6 per cent of the candidates have other than national languages as their native language. Among the parliamentary parties, the Green League (5.1 per cent), the Swedish People’s Party (4.5 per cent) and the Christian Democrats (3.5 per cent) have the highest proportion of candidates speaking other languages.
Based on main type of activity, 69.9 per cent of all candidates are employed, 6.0 per cent are unemployed and 24.2 per cent are in the inactive population. In relative terms, most employed candidates were nominated by the Movement Now (76.8 per cent). Among the parliamentary parties, the proportion of candidates in the inactive population is highest in the Christian Democrats (33.9 per cent).
The average disposable monetary income of candidates is EUR 28,425 per year. On average, the candidates of the Coalition Party have the highest income, EUR 33,932 per year, and the candidates of the Left Alliance, Finns Party and Christian Democrats have the lowest income of parliamentary parties, under EUR 26,000 per year.
The national register of candidates is published on the web pages of the Ministry of Justice ( www.vaalit.fi/en /). More detailed data on the candidates of the Municipal elections can be found in the review: Background analysis of candidates in the Municipal elections 2021.
Source: Municipal Elections 2021, nomination of candidates and background analysis of candidates, Statistics Finland
Inquiries: Sami Fredriksson 029 551 2696, Kaija Ruotsalainen 029 551 3599, Jaana Asikainen 029 551 3506, vaalit@stat.fi
Head of Department in charge: Hannele Orjala
Publication in pdf-format (861.6 kB)
- Reviews
- Tables
-
Tables in databases
Pick the data you need into tables, view the data as graphs, or download the data for your use.
Appendix tables
- Quality descriptions
-
- Municipal elections, quality description (4.6.2021)
Updated 04.06.2021
Official Statistics of Finland (OSF):
Municipal elections [e-publication].
ISSN=2323-1114. background analysis of advance voters 2021. Helsinki: Statistics Finland [referred: 19.4.2024].
Access method: http://www.stat.fi/til/kvaa/2021/01/kvaa_2021_01_2021-06-04_tie_001_en.html