5. Altogether 2,300 died as a result of accidents
In addition to stumbling and falling, other typical fatal accidents are poisonings, traffic, drownings, asphyxiations and fires. Here all other poisonings apart from alcohol poisonings, which belong to alcohol-related causes in the national time series classification, are considered accidents.
In 2017, accidents caused the death of more than 2,300 persons, of whom 1,500 were men and 800 women. Accidents caused four per cent of all deaths.
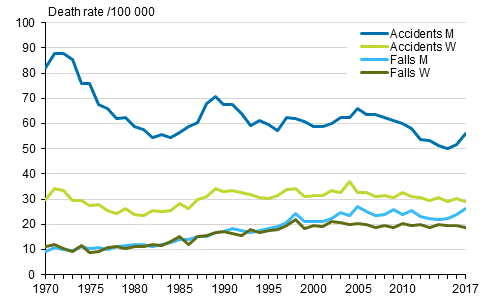
From 2004 the number of accidental deaths relative to the population decreased almost continuously for ten years. Fatal traffic accidents have particularly decreased. However, since 2016 the number of fatal accidents has increased. Growth is visible especially in the number of stumbling and falling accidents among men. The favourable development of men’s accident mortality seems to have come to a halt for the time being and the difference in mortality between men’s and women’s accident mortality has widened again.
Figure 9. Accident mortality and separately deaths from accidental falls in 1970 to 2017

The commonest accident leading to death is stumbling or falling. In 2017, more than 1,200 persons died from stumbles or falls, which is one-half of all fatal accidents. The majority, or nine out of ten, of fatal falls happened to persons aged over 65. The average age at death caused by falls was 81 years for men and 88 years for women. Relative to the number of living people, elderly men had clearly more fatal falls than women.
In 2017, a total of 291 persons died of accidental poisoning (excl. alcohol poisoning). Of them, 202 were men and 89 women. Men die of poisonings at a younger age than women. The average age of those dying of accidental poisonings was 39 years for men and 49 years for women. Compared with the previous year, poisoning deaths increased by around 50 cases. However, the number of poisoning deaths has decreased by more than 10 per cent in ten years.
The majority of accidental poisonings are poisonings from multiple substances, possibly involving several different pharmaceuticals as well as alcohol and/or drugs. The statistics have been compiled based on the substance judged as most influential.
One-half of accidental poisoning deaths were drug-related deaths as defined by the EMCDDA. In the majority of these, some kind of opioid (for example, buprenorphine, tramadol, codein, fentanyl) was judged to be the most influential substance. Compared to the previous year, the number of accidental drug poisonings increased to some extent in 2017. Accidental poisonings, where the most influential substances most often were tranquillisers and sleeping medicine (for example, benzodiazepines) increased more than drug poisonings in 2017. Deaths caused by benzodiazepines (38 cases) doubled from the year before. Most growth occurred in the under 40 age group.
The second most common fatal accidents were transport accidents. There were 244 deaths in transport accidents (excl. drowning accidents in water traffic) in 2017. The number of deaths has almost halved in the last ten years. Suicides committed in traffic are not included in deaths in transport accidents but in suicides in the statistics.
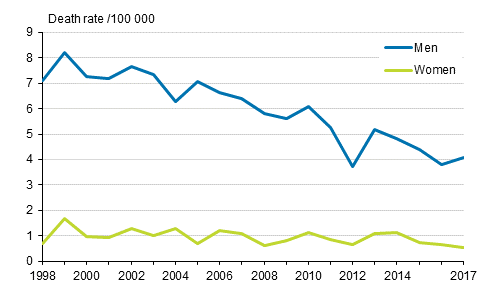
Drowning accidents include drowning from falling into water and drowning while swimming or boating. In 2017, altogether 126 persons drowned, 35 of whom in water traffic. The majority of drowning victims, nine out of ten, were men. Deaths by drowning have decreased clearly since the beginning of the 2000s when there were over 200 drowning victims per year (Figure 10).
In 2017, altogether 54 persons died in accidental fires while in 2016 the number of deaths was 77. The majority, or three out of four, of the victims were men. Deaths in accidental fires do not include deaths in deliberately lit fires. There were 11 persons that committed suicide with fire or smoke. There were 61 deaths caused by the heat of sauna and 69 deaths caused by hypothermia.
Figure 10. Mortality from drowning accidents in 1998 to 2017

More than one-half of those that died in accidental fires or drowned were intoxicated
In 2017, alcohol was a contributing factor in one in six fatal accidents, on average. Sixteen per cent of those who died in fatal accidents were alcohol intoxicated, i.e. 319 persons (Appendix table 2). Ten years ago, the corresponding share was 23 per cent of fatal accidents. In the statistics on causes of death, alcohol intoxication is determined from the death certificate. The figures exclude alcohol and drug poisonings where alcohol or drugs have directly caused the death.
In 2017, intoxication was most common in drownings and accidental fire deaths, where more than one-half of victims were under the influence of alcohol. Almost one-half of those who died in the sauna or outdoors from hypothermia were also intoxicated. In traffic deaths, one in five was intoxicated at the time of death. By contrast, in stumbling accidents, of which a majority occurred among persons aged over 70, fewer than one in ten were under the influence of alcohol.
Altogether 200 died from drugs
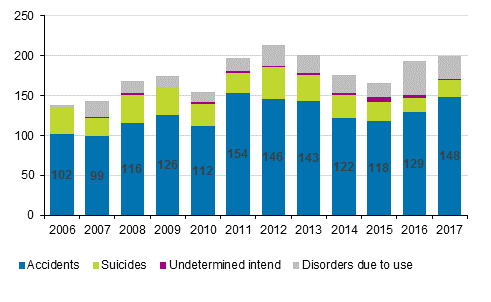
In 2017, the number of persons that died from drugs was 200 in Finland. This was six more than the previous year and 34 more than in 2015. The majority of those who died from drugs were men, only one in four was a woman. The average age at death (median) from drugs was 35 years for men and 46 years for women. Most drug-related deaths occurred among men aged 30 to 34. There were 3.6 drug-related deaths per 100,000 inhabitants.
Drug-related deaths have been calculated using the definition (Selection B 1) ) compiled by the European Monitoring Centre for Drugs and Drug Addiction EMCDDA . According to the classification, cases where the underlying cause of death is drug psychoses, accidental poisoning, self-inflicted poisoning, and poisoning with undetermined intent are calculated as drug-related deaths, as well as mental and behavioral disorders due to use of drugs. In addition to opioids, the definition classifies cannabis and cannabinoids, other hallucinogens, and stimulants suitable for abuse, such as amphetamine and its derivatives as drugs.
The majority of drug-related deaths are accidental poisonings. In 2017, there were 148 accidental overdoses. The number is higher than in previous years. Self-inflicted poisonings with drugs are suicides. In 2017, a total of 22 suicides were committed with drugs, over one-half of them by women. Deaths related to mental and behavioral disorders due to use of drugs are usually a result of drug addiction or long-term drug use.
Figure 11. Drug-related deaths 2006 to 2017 (EMCDDA definition)

Drug-related deaths are classified based on the substance judged as most influential. The majority are poisonings from multiple substances, where the person has used other substances in addition to drugs, such as psychopharmacons and/or alcohol. In drug poisonings resulting in death, combined use of drugs and pharmaceuticals was most common.
In 2017, three out of four drug-related deaths in Finland were associated with overdoses of opioids. The most influential substances were mostly synthetic medicinal opioids (the most common buprenorphine). Causes of death data are classified in accordance with the WHO’s International Classification of Diseases (ICD-10), where several drugs are classified under the same code. Therefore, the statistics on causes of death offer limited possibilities for substance-specific examinations. More detailed information is available from the Forensic Toxicology Unit of the National Institute for Health and Welfare that performs the forensic toxicology tests related to determining the cause of death.
Table 4. Drug-related mortality 2000 to 2017
| Total | Males | Females | Total | Males | Females | |
| Number | Number | Number | Per 100 000 mean population | Per 100 000 mean population | Per 100 000 mean population |
|
| 2000 | 134 | 109 | 25 | 2,6 | 4,3 | 0,9 |
| 2001 | 110 | 78 | 32 | 2,1 | 3,1 | 1,2 |
| 2002 | 97 | 69 | 28 | 1,9 | 2,7 | 1,1 |
| 2003 | 101 | 76 | 25 | 1,9 | 3,0 | 0,9 |
| 2004 | 135 | 96 | 39 | 2,6 | 3,8 | 1,5 |
| 2005 | 126 | 95 | 31 | 2,4 | 3,7 | 1,2 |
| 2006 | 138 | 107 | 31 | 2,6 | 4,2 | 1,2 |
| 2007 | 143 | 116 | 27 | 2,7 | 4,5 | 1,0 |
| 2008 | 169 | 120 | 49 | 3,2 | 4,6 | 1,8 |
| 2009 | 175 | 130 | 45 | 3,3 | 5,0 | 1,7 |
| 2010 | 156 | 117 | 39 | 2,9 | 4,4 | 1,4 |
| 2011 | 197 | 156 | 41 | 3,7 | 5,9 | 1,5 |
| 2012 | 213 | 161 | 52 | 3,9 | 6,1 | 1,9 |
| 2013 | 201 | 148 | 53 | 3,7 | 5,5 | 1,9 |
| 2014 | 176 | 141 | 35 | 3,2 | 5,2 | 1,3 |
| 2015 | 166 | 127 | 39 | 3,0 | 4,7 | 1,4 |
| 2016 | 194 | 152 | 42 | 3,5 | 5,6 | 1,5 |
| 2017 | 200 | 147 | 53 | 3,6 | 5,4 | 1,9 |
1) ICD-10 codes F11-F12, F14-F16, F19 and X41, X42, X61, X62, Y11 and Y12 together with T codes (T40.0-9,T43.6.)
Source: Causes of death, Statistics Finland
Inquiries: Airi Pajunen 029 551 3605, Jari Hellanto 029 551 3291, Kati Taskinen 029 551 3648, kuolemansyyt@stat.fi
Director in charge: Jari Tarkoma
Updated 17.12.2018
Official Statistics of Finland (OSF):
Causes of death [e-publication].
ISSN=1799-5078. 2017,
5. Altogether 2,300 died as a result of accidents
. Helsinki: Statistics Finland [referred: 16.4.2024].
Access method: http://www.stat.fi/til/ksyyt/2017/ksyyt_2017_2018-12-17_kat_005_en.html

