

This set of statistics has been discontinued.
New data are no longer produced from the statistics.
Published: 15 July 2010
Productivity of local goverment weakened slightly in 2008
Corrected on 15 July 2010. The corrections are in red font and they also affect the tables and the graph. Statistics describing the productivity of local government in 2008 were originally released on 5 February 2010. The source data on specialised health care received from the National Institute for Health and Welfare that were available at that time have now become revised. The revision affects the output figures for health care and total activities, as well as data on total productivity.
According to revised data of Statistics Finland’s statistics on local government productivity, the combined total productivity of education, health care and social work of local government fell by 0.7 per cent in 2008. Productivity weakened because the volume of total input grew by more than the volume of output . The volume of total input grew by 2.5 per cent, while the volume of output grew by 1.8 per cent.
Volume changes in the output and total input and changes in total productivity of local government by industry in 2008, per cent from the year before
| 2008 | Education | Health | Social work | Total |
| Output | -1.4 | 2.9 | 3.7 | 1.8 |
| Total input | -0.7 | 3.9 | 4.2 | 2.5 |
| Total productivity | -0.6 | -0.9 | -0.5 | -0.7 |
Productivity fell in all of the three examined activities in 2008. In education, total input decreased by 0.7 per cent but because output diminished by more than this, productivity weakened by some 0.5 per cent. Productivity also weakened by approximately 0.5 per cent in social work, as total input grew by over four per cent but output by under four per cent. In health care output went up by some three per cent but total input by nearly four per cent, so productivity fell by 0.9 per cent .
Development in the total productivity of education, health and social work of local government in 2002–2008 (2002=100)
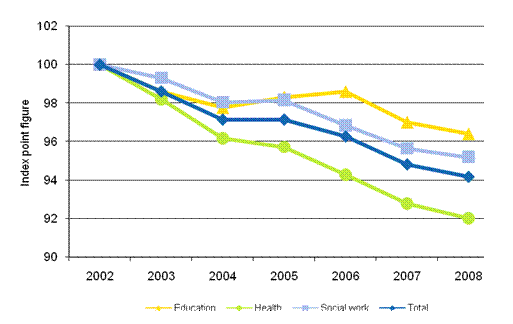
Between 2002 and 2008, the combined productivity of local government has fallen by six per cent. In education total productivity fell by four per cent, in social work by five per cent and in health care by eight per cent.
The entire 2001-2008 time series of these statistics on local government productivity has become slightly revised in this release due to the revision of the time series of national accounts published on 29 January 2010. The statistics are compiled at the level of the whole country and the data are not available by municipality or joint municipal board.
Source: Statistics on local government productivity 2008. Statistics Finland.
Inquiries: Niina Suutarinen (09) 1734 3302, julkinen.tuottavuustilasto@stat.fi
Director in charge: Ari Tyrkk�
Publication in pdf-format (254.5 kB)
Updated 15.7.2010
Official Statistics of Finland (OSF):
Statistics on local government productivity [e-publication].
ISSN=1797-3260. 2008. Helsinki: Statistics Finland [referred: 19.4.2024].
Access method: http://www.stat.fi/til/kktu/2008/kktu_2008_2010-07-15_tie_001_en.html