

Published: 21 December 2016
Total energy consumption went up by 3 per cent in January to September
According to Statistics Finland's preliminary data, total energy consumption in January to September amounted to 985 petajoule, which was three per cent more than in the corresponding period in 2015. Electricity consumption amounted to 62 terawatt hours (TWh), which is three per cent more than one year earlier. Carbon dioxide emissions of the energy sector similarly rose by three per cent year-on-year. Colder weather than last year contributed to the rise in total energy consumption.
Total energy consumption
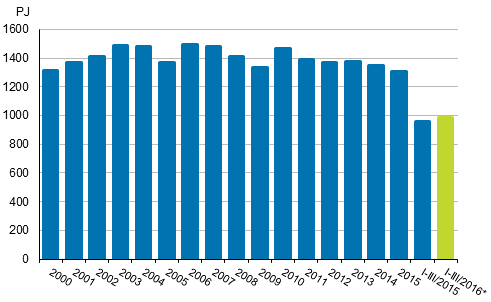
*preliminary
Among fuels, the consumption of wood fuels increased most in January to September, by eight per cent. The consumption of coal grew by five per cent and that of oil by three per cent. Substantial falls were recorded for natural gas, whose consumption went down by 12 per cent and for peat, which was consumed ten per cent less than one year ago.
Net imports of electricity grew in January to September by 15 per cent compared with the corresponding period last year, being higher than ever before. The share of net imports in total electricity consumption stood at 23 per cent. The use of wind power grew by 27 per cent. Hydro power and nuclear energy were used for electricity production nearly as much as one year ago.
In January to September, diverse energy products were imported into Finland to the value of EUR 5.0 billion, which was 15 per cent less than one year earlier. Imports came mostly from Russia, whose share of the value of imports was 64 per cent. Energy products were exported to the value of EUR 2.8 billion, which was one per cent more than one year previously. Exports went most to OECD countries, which accounted for 78 per cent of the value of exports. The fallen world market price of oil contributed to the reduction in the value of imports of energy products.
Stocks of coal amounted to 18 TWh at the end of September, which was 28 per cent less than one year earlier. At the end of September, it was estimated that the peat stocks contained 18 TWh of energy peat, or one per cent less than one year earlier.
Total energy consumption by source (TJ) and CO2 emissions (Mt)
| Energy source | I-III/2016* | Annual change-%* | Percentage share of total energy consumption* |
| Oil 1) 1) | 235,554 | 3 | 24 |
| Coal 2) | 76,788 | 5 | 8 |
| Natural gas 3) | 53,114 | -12 | 5 |
| Nuclear Energy 4) | 178,776 | 1 | 18 |
| Net Imports of Electricity 5) | 50,835 | 15 | 5 |
| Hydro power 5) | 45,100 | 0 | 5 |
| Wind power 5) | 6,810 | 27 | 1 |
| Peat | 36,600 | -10 | 4 |
| Wood fuels | 264,297 | 8 | 27 |
| Others 6) | 37,452 | -1 | 4 |
| TOTAL ENERGY CONSUMPTION | 985,324 | 3 | 100 |
| Bunkers | 28,109 | -5 | . |
| CO2 emissions from energy sector | 30 | 3 | . |
. = Category not applicable
1) Oil: includes the bio part of transport fuels.
2) Coal: includes hard coal, coke, blast furnace gas and coke oven gas.
3) The consumption of natural gas does not include raw material use.
4) Conversion of electricity generation into fuel units: Nuclear power: 10.91 TJ/GWh (33% total efficiency)
5) Conversion of electricity generation into fuel units: Hydro power, wind power and net imports of electricity: 3.6 TJ/GWh (100%)
6) Others: includes exothermic heat from industry, recovered fuels and heat pumps.
Source: Statistics Finland, Energy supply and consumption
Inquiries: Ville Maljanen 029 551 2691, energia@stat.fi
Director in charge: Ville Vertanen
Publication in pdf-format (256.5 kB)
- Tables
-
Tables in databases
Pick the data you need into tables, view the data as graphs, or download the data for your use.
- Figures
-
- Appendix figure 1. Changes in GDP, Final energy consumption and electricity consumption (21.12.2016)
- Appendix figure 2. Carbon dioxide emissions from fossil fuels and peat use (21.12.2016)
- Appendix figure 3. Hard coal consumption (21.12.2016)
- Appendix figure 4. Consumption of natural gas (21.12.2016)
- Appendix figure 5. Energy peat consumption (21.12.2016)
- Appendix figure 6. Domestic oil deliveries (21.12.2016)
- Revisions in these statistics
-
- Revisions in these statistics (21.12.2016)
Updated 21.12.2016
Official Statistics of Finland (OSF):
Energy supply and consumption [e-publication].
ISSN=1799-7976. 3rd quarter 2016. Helsinki: Statistics Finland [referred: 16.4.2024].
Access method: http://www.stat.fi/til/ehk/2016/03/ehk_2016_03_2016-12-21_tie_001_en.html