

Published: 20 December 2013
Use of wood and coal grew in energy production in January to September
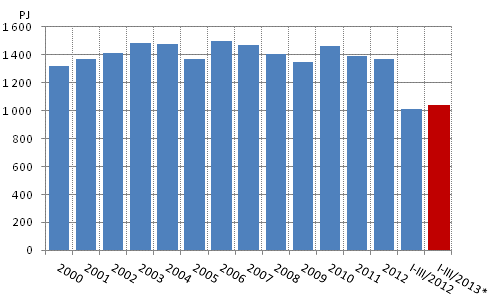
According to Statistics Finland's preliminary data, total energy
consumption in the January to September period amounted to around
1,039 petajoule (PJ), which is two per cent more than in the
corresponding period of 2012. The consumption of electricity
amounted to 61.7 terawatt hours (TWh), which is almost at the same
level as one year before. Net imports of electricity went down by
around 1.7 TWh, or by about 13 per cent. Imported electricity was
replaced with domestic production, but mainly with imported fuels.
The consumption of coal grew by 35 per cent (35 PJ) and that of
wood fuels by 12 per cent (27 PJ). Separate production of
electricity with hard coal quadrupled from one year before. The
consumption of peat went down by 30 per cent, or 20 PJ. Carbon
dioxide emissions increased by one per cent from the corresponding
period last year.
Total energy consumption
*preliminary
In the third quarter, water reserves were smaller than average, for which reason the production of hydro power went down by 38 per cent. Net imports of electricity went up by nearly two per cent. The consumption of coal increased by 71 per cent in the third quarter. A decline could be seen in the consumption of domestic peat and forest chippings in the third quarter.
The consumption of nuclear energy grew by around six PJ, or some three per cent. Among individual energy sources, the largest reduction of 30 per cent was seen in the consumption of peat (27 PJ). The consumption of natural gas went down by four per cent (3 PJ) and the production of hydro power decreased by over 17 per cent (8 PJ) in the January to September period of 2013.
Domestic production of electricity increased by over three per cent. Nearly 19 per cent of the electricity consumed in Finland was covered with imported electricity. Net imports from the Nordic countries declined by 24 per cent. The production of condensate power grew by 76 per cent and combined heat and power production went up by more than two per cent. Combined heat and power production increased by over 13 per cent in industry's combined power plants, but decreased by five per cent in district heating plants in the January to September period of 2013.
In January to September, diverse energy products were imported into Finland to the value of EUR 10.4 billion, which was five per cent more than one year earlier. Most energy products were imported from Russia, to the value of EUR 6.9 billion. Correspondingly, energy products were exported from Finland to the value of EUR 5.1 billion, which was ten per cent more than one year previously. Most energy products were exported from Finland to Sweden. Growth was due to livelier exports and imports of medium distillates and petrol. In September, stocks of coal amounted to some 22 TWh, which was 25 per cent less than one year earlier. Stocks of energy peat were estimated to be around 16 TWh, which was 44 per cent more than one year ago.
Total energy consumption by source (TJ) and CO2 emissions (Mt)
| Energy source | I-III/2013* 4) | Annual change-%* | Percentage share of total energy consumption* |
| Oil | 233,468 | -3 | 22 |
| Coal 1) | 135,379 | 35 | 13 |
| Natural gas | 78,533 | -4 | 8 |
| Nuclear energy 2) | 182,534 | 3 | 18 |
| Net imports of electricity 3) | 41,338 | -13 | 4 |
| Hydro and wind power 3) | 37,828 | -16 | 4 |
| Peat | 47,594 | -30 | 5 |
| Wood fuels | 257,030 | 12 | 25 |
| Others | 25,745 | 0 | 2 |
| TOTAL ENERGY CONSUMPTION | 1,039,448 | 2 | 100 |
| Bunkers | 23,923 | 3 | . |
| CO2 emissions from energy sector | 38 | 1 | . |
2) Conversion of electricity generation into fuel units: Nuclear power: 10.91 TJ/GWh (33% total efficiency)
3) Conversion of electricity generation into fuel units: Hydro power, wind power and net imports of electricity: 3.6 TJ/GWh (100%)
4) *preliminary
Source: Statistics Finland, Energy supply and consumption
Inquiries: Pentti Wanhatalo 09 1734 2685, energia@stat.fi
Director in charge: Leena Storg�rds
Publication in pdf-format (306.0 kB)
- Tables
-
Tables in databases
Pick the data you need into tables, view the data as graphs, or download the data for your use.
- Figures
-
- Appendix figure 1. Changes in GDP, final energy consumption and electricity consumption (20.12.2013)
- Appendix figure 2. Carbon dioxide emissions from fossil fuels and energy peat use (20.12.2013)
- Appendix figure 3. Hard coal consumption (20.12.2013)
- Appendix figure 4. Natural gas consumption (20.12.2013)
- Appendix figure 5. Energy peat consumption (20.12.2013)
- Appendix figure 6. Domestic oil deliveries (20.12.2013)
- Revisions in these statistics
-
- Revisions in these statistics (20.12.2013)
Updated 20.12.2013
Official Statistics of Finland (OSF):
Energy supply and consumption [e-publication].
ISSN=1799-7976. 3rd quarter 2013. Helsinki: Statistics Finland [referred: 20.4.2024].
Access method: http://www.stat.fi/til/ehk/2013/03/ehk_2013_03_2013-12-20_tie_001_en.html