This set of statistics has been discontinued.
New data are no longer produced from the statistics.
Published: 11 October 2013
Central government productivity weakened in 2012
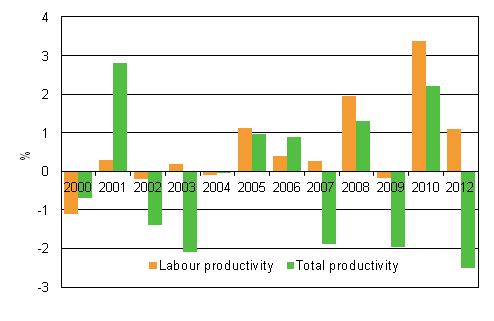
The productivity of central government agencies and institutions deteriorated in 2012 from the previous year. The productivity of labour rose by 1.1 per cent and total productivity weakened by 2.5 per cent from 2011. The added up volume of output of central government agencies and institutions fell by around one per cent. Labour input diminished by 2.1 per cent and total input rose by 1.5 per cent. These data derive from the statistics on central government productivity compiled by Statistics Finland.
Development in the productivity of central government agencies and institutions from previous year, %

The most visible change in 2012 was the weakening of total productivity by 2.5 per cent. The 2.1 per cent fall in labour input was also significant. Total productivity deteriorated because total input went up by 1.5 per cent and the volume of output went down by 1.0 per cent. In turn, the rise in the productivity of labour was caused by the fact that the use of labour input fell more than the volume of output. The productivity of labour has been growing continuously since 2005 in all statistical years except for the year 2009, when the productivity of labour dropped slightly. By contrast, the development in total productivity has fluctuated in different years. The weakening in total productivity was slightly stronger in 2012 than in the previous years.
Calculations for the statistics on central government productivity are performed as an examination of pairs of years by comparing the volumes of outputs and inputs for the services of a respondent unit in two successive years. Units removed from the central government sector and newly established units without comparison data from the preceding year are excluded from the comparison. The agencies and institutions included in the measurement vary slightly from one year and administrative sector to the next depending on the quantity and quality of the obtained responses.
Source: Statistics on central government productivity 2012. Statistics Finland.
Inquiries: Tomi Rajala 09 1734 3385, julkinen.tuottavuustilasto@stat.fi
Director in charge: Leena Storgårds
Publication in pdf-format (223.2 kB)
Updated 11.10.2013
Official Statistics of Finland (OSF):
Statistics on central government productivity [e-publication].
ISSN=1797-0490. 2012. Helsinki: Statistics Finland [referred: 19.4.2024].
Access method: http://www.stat.fi/til/vatt/2012/vatt_2012_2013-10-11_tie_001_en.html

