

Published: 8 February 2019
Industrial output grew in December both year-on–year and from the previous month
Seasonally adjusted industrial output (TOL BCD) grew by 1.3 per cent in December from the month before. According to Statistics Finland, industrial output adjusted for working days was 3.3 per cent higher in December 2018 compared to December 2017. Last year, industrial output grew by 3.7 per cent. Industrial output has grown for three years in a row, but output is still good nine per cent below the level that prevailed prior to the financial crisis in 2008.
Trend and seasonally adjusted series of industrial output (BCD), 2007/01 to 2018/12
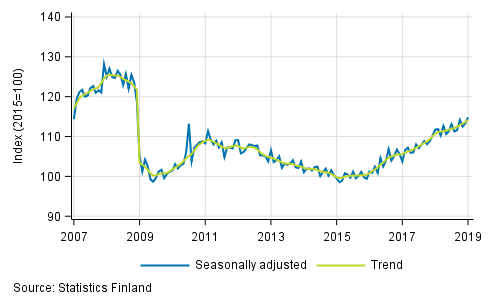
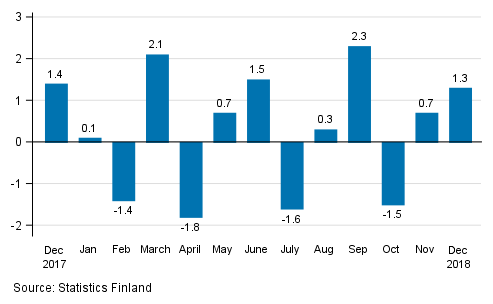
In December, seasonally adjusted output went up by 1.3 per cent from the month before. In November seasonally adjusted output increased by 0.7 per cent from October.
Seasonally adjusted change in industrial output (BCD) from previous month, %, TOL 2008
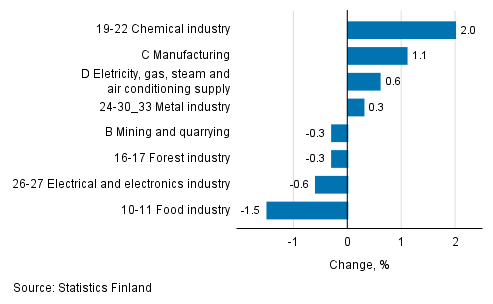
Adjusted for seasonal variation, industrial output increased in December most in the chemical industry, by 2.0 per cent. In the metal industry, output increased by 0.3 per cent. Output went down most in the food industry, by 1.5 per cent.
Seasonal adjusted change in industrial output by industry, 11/2018 to 12/2018, %, TOL 2008
Revised data for December 2018 will be published at 9 am on 8 March 2019 in connection with the release of industrial output data for January 2019. The revision is influenced by the estimation used in the latest release, which is based on the Tax Administration's data on self-assessed taxes used for enterprises with fewer than 50 employees. Because of the method used, seasonally adjusted figures for previous months may change even if the original figures do not become revised. The seasonally adjusted figures are also adjusted for working days.
Source: Volume Index of Industrial Output 2018, December. Statistics Finland
Inquiries: Kari Rautio 029 551 2479, Maarit M�kel� 029 551 3324, volyymi.indeksi@stat.fi
Director in charge: Mari Yl�-Jarkko
Publication in pdf-format (360.6 kB)
- Reviews
- Tables
-
Tables in databases
Pick the data you need into tables, view the data as graphs, or download the data for your use.
- Figures
-
- Appendix figure 1. Three months' year-on-year change in manufacturing (C) sub-industries adjusted for working days (TOL 2008) (8.2.2019)
- Appendix figure 2. Trend series of manufacturing sub-industries, 2007/01 to 2018/12, TOL 2008 (8.2.2019)
- Appendix figure 3. Seasonally adjusted industrial output Finland, Germany, Sweden, France and United Kingdom (BCD) 2007 to 2019, TOL 2008 (8.2.2019)
- Revisions in these statistics
-
- Revisions in these statistics (8.2.2019)
Updated 8.2.2019
Official Statistics of Finland (OSF):
Volume index of industrial output [e-publication].
ISSN=1798-9272. December 2018. Helsinki: Statistics Finland [referred: 18.4.2024].
Access method: http://www.stat.fi/til/ttvi/2018/12/ttvi_2018_12_2019-02-08_tie_001_en.html