

This set of statistics has been discontinued.
Statistical data on this topic are published in connection with another set of statistics.
Data published after 5 April 2022 can be found on the renewed website.
Published: 18 December 2014
Household-dwelling units in Kauniainen clearly have the highest income
According to the regional data of Statistics Finland's Total statistics on income distribution, household-dwelling units in Kauniainen had by far the highest income in Finland. A household-dwelling unit in Kauniainen received, on average, EUR 133,630 in gross income in 2013, while the average gross income for the next richest household-dwelling units in Espoo, Sipoo and Kirkkonummi was good EUR 70,000. Especially property income, and wage and salary income boosted the income of people in Kauniainen, as they received clearly more of such income than household-dwelling units elsewhere in Finland.
Average gross income of household-dwelling units and their structure in 2013, municipalities with the highest and lowest income
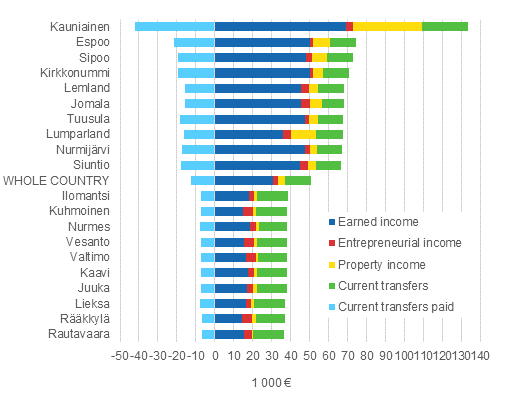
Household-dwelling units had the lowest income in eastern Finland, in Rautavaara the average gross income of household-dwelling units was EUR 36,360. In Rääkkylä, the corresponding income was EUR 36,760 and in Lieksa EUR 37,210. In the entire country, the average gross income of household-dwelling units was EUR 50,770 in 2013.
Current transfers received were a considerable source of income for household-dwelling units in the lower income areas. In Rautavaara and Lieksa, the share of current transfers received of gross income was, on average, 44 per cent in 2013. Current transfers received consist mainly of old-age and disability pensions, as well as social security benefits relating to unemployment. The share of wage and salary income, entrepreneurial income and property income, or factor income in the overall income of an average household-dwelling unit is around 56 per cent in these municipalities.
By contrast, in the municipalities with the highest income, factor income forms a more considerable share of the overall income of an average household-dwelling unit. In Kauniainen, the gross income share of factor income was last year 82 per cent, and the share of current transfers received was only 18 per cent. In Kauniainen, around 75 per cent of current transfers received were old-age pensions. A special characteristics of Kauniainen is also the high importance of property income, its share of the overall income of household-dwelling units was 27 per cent, on average. Property income consist of dividend and rental income and taxable sales profits. In the municipalities with the lowest income, the share of property income in gross income was under three per cent.
The income differentials between household-dwelling units are, however, evened out by taxation, as in Kauniainen with the highest income, household-dwelling units paid, on average, EUR 42,150 in taxes and tax-like payments on their income in 2013. In Espoo, the municipality with the next highest income, the corresponding amount of income taxes was around one-half smaller, i.e. EUR 21,310. In the municipality with the lowest income, Rautavaara, the taxes paid by household-dwelling units on their income were EUR 6,790, on average.
Source: Total statistics on income distribution, Statistics Finland
Inquiries: Pekka Ruotsalainen 029 551 2610
Director in charge: Riitta Harala
- Tables
-
Tables in databases
Pick the data you need into tables, view the data as graphs, or download the data for your use.
Updated 18.12.2014
Official Statistics of Finland (OSF):
Total statistics on income distribution [e-publication].
Income development by area 2013. Helsinki: Statistics Finland [referred: 20.4.2024].
Access method: http://www.stat.fi/til/tjkt/2013/01/tjkt_2013_01_2014-12-18_tie_001_en.html