

Published: 18 June 2020
Households' saving rate grew and non-financial corporations’ profit share fell in the first quarter of 2020
Households’ saving rate grew in January to March from the previous quarter. The saving rate grew because households received more compensation of employees while consumption expenditure decreased slightly. Households’ investment rate remained on level with the previous quarter. The profit share of the non-financial corporations sector fell because wages and salaries paid by the sector grew and value added remained almost unchanged. The investment rate of the non-financial corporations sector grew from the previous quarter. These data derive from Statistics Finland’s quarterly sector accounts.
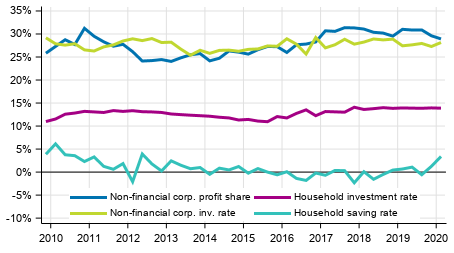
Key indicators for households and non-financial corporations, seasonally adjusted
The key figures were calculated from seasonally adjusted time series. Sector accounts are calculated only at current prices. However, a volume indicator describing the development adjusted for price changes is calculated for households' adjusted disposable income. The profit share, saving rate and investment rate are calculated from net figures, which means that consumption of fixed capital is taken into account. Households do not include non-profit institutions serving households.
The exceptional situation caused by the coronavirus pandemic and the macroeconomic shock have not significantly affected the compilation or figures of the statistics for the first quarter. Only the main source data used in the compilation of monetary financial institutions and other financial institutions were now less detailed than usual. In addition, as a result of corona support measures, accrual-based calculation of tax revenue may contain more uncertainty than usual.
A more detailed breakdown of financial and insurance sectors (S12) has been added to the database table describing the sectors' income and expenditure. The new sectors are S121-S123 Monetary financial corporations, S124-S127 Other financial corporations and S128, S129 Insurance corporations and pension funds.
Households
In January to March, households' seasonally adjusted saving rate grew by two percentage points to 3.4 per cent. The saving rate is derived by deducting consumption expenditure from disposable income. The saving is positive if households' disposable income is greater than households' consumption expenditure. The saving rate refers to the share of households’ savings in disposable income. Households' rate of indebtedness was 129.7 per cent. The indebtedness rate expresses the proportion of loan debts relative to total disposable income.
Households' seasonally adjusted investment rate remained unchanged from the previous quarter and stood at 13.9 per cent. The investment rate is the ratio of households' investments to disposable income. Most of households' investments were investments in dwellings.
In the first quarter of 2020, households’ disposable income grew at current prices by 3.7 per cent, that is, by about EUR one billion from the corresponding quarter of the year before. The key components of disposable income on the income side are wages and salaries received, entrepreneurial and property income, and social benefits received. The biggest expense items are taxes paid and social contributions. On the income side, the most significant change in the first quarter of 2020 was the growth in compensation of employees received by good EUR 800 million and on the expense side the growth in social security contributions by good EUR 300 million compared to the figures one year ago.
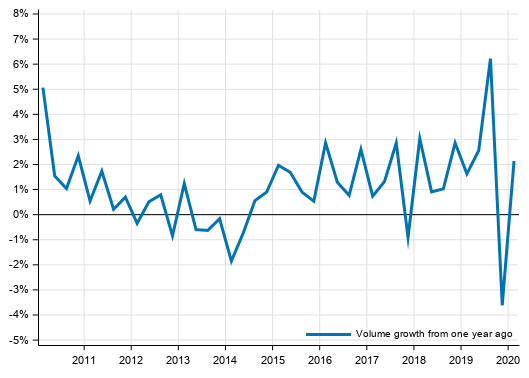
When individual services produced by the public sector and non-profit institutions, such as educational, health and social services, are added to disposable income, the concept of adjusted disposable income can be attained. Adjusted disposable income is the indicator recommended by the OECD for evaluating the economic well-being of households. In the first quarter of 2020, households’ adjusted disposable income grew at current prices by 3.9 per cent and adjusted for price changes by 2.1 per cent from the corresponding quarter of the year before.
Volume development of households’ adjusted disposable income
Compensation of employees paid by non-profit institutions serving households increased by 2.4 per cent compared with the quarter of one year ago.
In these statistics, the households sector only covers the actual households sector S14. Sector S15, non-profit institutions serving households, is calculated and published separately. In Eurostat’s publication, the households sector also includes the data for sector S15. Another difference to Eurostat's publication is in how consumption of fixed capital is taken into account. Eurostat publishes investment and saving rates as gross figures, i.e. including consumption of fixed capital. Net data are used in these statistics, that is, when consumption of fixed capital is taken into account, saving and investment rates decrease.
Profit share of non-financial corporations declining
In the first quarter of 2020, the seasonally adjusted profit share of non-financial corporations contracted by 0.7 percentage points to 28.9 per cent. The profit share of non-financial corporations has now fallen in three successive quarters. The profit share refers to the share of the operating surplus in value added. The profit share contracted because non-financial corporations paid more wages and salaries than in the previous quarter, but value added remained unchanged. The investment rate of non-financial corporations, or the proportion of fixed capital investments in value added grew by 0.8 percentage points to 28.1 per cent.
The financial surplus or net lending calculated from figures unadjusted for seasonal variation improved by EUR 1.1 billion from the corresponding quarter last year and amounted to EUR -1.6 billion. The change is based not only on the contraction of the operating surplus but also on the growth in property expenditure.
Profits of financial and insurance corporations grew
In the first quarter of the year, seasonally adjusted value added in financial and insurance corporations grew by 8.1 per cent from the previous quarter. Output grew by 0.8 per cent and intermediate consumption fell by 3.9 per cent. The operating surplus describing profits in the sector grew by 12.6 per cent from EUR 601 million in the previous quarter to EUR 677 million. Profits grew particularly in other financial corporations. Compensation of employees, in turn, increased by 3.5 per cent from the previous quarter. Value added and operating surplus describe the income that is generated from providing financial services to the public. They do not include property income or holding gains of securities.
Financial position of general government weakened from a year ago
Consolidated total general government revenue grew less than consolidated total expenditure. The difference between revenue and expenditure, that is, the deficit (net borrowing) of general government grew by EUR 300 million from the year before and amounted to EUR 900 million.
The statistics on quarterly sector accounts examines general government as a whole. More detailed information on quarterly sector accounts of general government can be found in the statistics on general government revenue and expenditure where the sub-sectors are specified: http://www.stat.fi/til/jtume/index_en.html
Current account in deficit in the first quarter of 2020
Exports of goods from Finland amounted to EUR 14.3 billion in the first quarter of 2020, which was 12.3 per cent less than one year ago. Exports of services amounted to EUR 6.7 billion, which was 4.7 per cent more than one year ago. Imports of goods to Finland amounted to EUR 14.4 billion. Compared to one year ago, the value of imports of goods decreased by 5.0 per cent. Imports of services amounted to EUR 7.8 billion, which was 1.7 per cent less than one year ago. The balance of goods and services showed a deficit of EUR 1.1 billion.
Property income received from the rest of the world was almost in balance with property income paid to the rest of the world. Property income includes dividends, interests and reinvested earnings. Current transfers paid abroad from Finland were around EUR 0.7 billion higher than current transfers paid from abroad to Finland. The most significant current transfer item is the GNI payment paid by the state to the EU.
The current account was EUR 1.6 billion in deficit in the first quarter of 2020.
Data and methods used
The quarterly data become revised as source data are updated. The biggest revisions take place for the last two to three years, because the data in the annual accounts are still preliminary. The data in the publication are based on the data sources available by 6 June 2020. The data for 1999 to 2019 mainly correspond with the annual sector accounts of the National Accounts.
The saving rate, profit share and investment rate in the quarterly publication of sector accounts are net amounts, i.e. consumption of fixed capital has been removed from the figures. In addition, financial accounts data on the stock of households’ loan debts are used in calculating households’ indebtedness rate. The indebtedness rate is presented adjusted and non-adjusted for seasonal variation in the database table of sector accounts. The indebtedness rate from figures non-adjusted for seasonal variation is published by financial accounts. The key indicators in these statistics were calculated as follows:
Households' saving rate = B8N / (B6N+D8R)
Households' investment rate = P51K / (B6N+D8R)
Households' indebtedness rate = F4 / B6N
Profit share of non-financial corporations = B2N / B1NPH
Investment rate of non-financial corporations = P51K / B1NPH
The volume indicator of households' adjusted disposable income is calculated using the price data of the statistics on quarterly national accounts, with which the components of adjusted disposable income are deflated. Households' disposable income is deflated with the implicit price index of household consumption expenditure. Price data are also available for the consumption of non-profit institutions serving households. As a methodological shortcoming, general government individual consumption expenditure has to be deflated with the total general government consumption expenditure for lack of more accurate data. The volume time series was formed with the annual overlap method.
Source: Sector accounts, Statistics Finland
Inquiries: Jarkko Kaunisto 029 551 3551, Katri Soinne 029 551 2778, kansantalous.suhdanteet@stat.fi
Director in charge: Jan Nokkala
Publication in pdf-format (448.4 kB)
- Tables
-
Tables in databases
Pick the data you need into tables, view the data as graphs, or download the data for your use.
Appendix tables
- Figures
- Revisions in these statistics
-
- Revisions in these statistics (18.6.2020)
Updated 18.6.2020
Official Statistics of Finland (OSF):
Quarterly sector accounts [e-publication].
ISSN=2243-4992. 1st quarter 2020. Helsinki: Statistics Finland [referred: 19.4.2024].
Access method: http://www.stat.fi/til/sekn/2020/01/sekn_2020_01_2020-06-18_tie_001_en.html