

Published: 20 December 2017
Non-financial corporations sector’s profits grew in the third quarter of 2017
The profit share of the non-financial corporations sector grew compared to the previous quarter as the sector's value added grew and compensation of employees paid remained almost unchanged. Non-financial corporations’ investment rate also continued to grow. Households’ saving rate weakened in July to September from the previous quarter. The saving rate fell, because consumption expenditure increased faster than disposable income. Households’ investment rate remained on level with the previous quarter. These data derive from Statistics Finland’s quarterly sector accounts.
Key indicators for households and non-financial corporations, seasonally adjusted
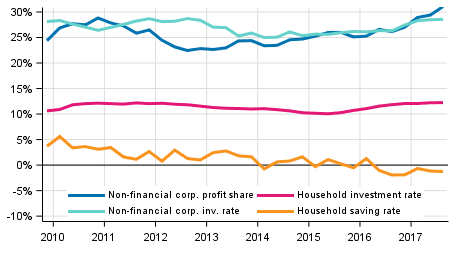
In July to September, households' saving rate declined by 0.1 percentage points to -1.3 per cent. The saving rate refers to the share of households’ savings in disposable income. Households’ investment rate was unchanged and stood at 12.2 per cent. Most of households' investments were investments in dwellings. Households' adjusted disposable income grew from the corresponding quarter in 2016 by 2.2 per cent adjusted for price changes. Adjusted income is the indicator recommended by the OECD for evaluating the economic well-being of households. Adjusted disposable income is derived by adding individual services produced by the public sector, such as education, health and social services, to the disposable income of households.
In the third quarter of 2017, the profit share of non-financial corporations, or the share of profits in value added, grew to 31.1 per cent from 29.4 per cent in the previous quarter. The investment rate of non-financial corporations, or the proportion of investments in value added, rose by 0.1 percentage points to 28.6 per cent.
The key figures were calculated from seasonally adjusted time series. Sector accounts are calculated only at current prices. However, a volume indicator describing the development adjusted for price changes is calculated for households' adjusted disposable income in a separate Appendix table. The profit share, saving rate and investment rate are calculated from net figures, which means that consumption of fixed capital is taken into account. Households do not include non-profit institutions serving households.
Source: Sector accounts, Statistics Finland
Inquiries: Pekka Tamminen 029 551 2460, Juha Martikainen 029 551 3225, kansantalous.suhdanteet@stat.fi
Director in charge: Ville Vertanen
Publication in pdf-format (396.9 kB)
- Reviews
- Tables
-
Tables in databases
Pick the data you need into tables, view the data as graphs, or download the data for your use.
Appendix tables
- Figures
-
- Appendix figure 1. Volume development of households adjusted disposable income (20.12.2017)
- Appendix figure 2. Households saving rate (20.12.2017)
- Appendix figure 3. Households investment rate (20.12.2017)
- Appendix figure 4. Non - financial corporations profit share (20.12.2017)
- Appendix figure 5. Non - financial corporations investment rate (20.12.2017)
- Revisions in these statistics
-
- Revisions in these statistics (20.12.2017)
Updated 20.12.2017
Official Statistics of Finland (OSF):
Quarterly sector accounts [e-publication].
ISSN=2243-4992. 3rd quarter 2017. Helsinki: Statistics Finland [referred: 19.4.2024].
Access method: http://www.stat.fi/til/sekn/2017/03/sekn_2017_03_2017-12-20_tie_001_en.html