

Published: 19 December 2014
Households’ consumption expenditure higher than income in the third quarter of 2014
The saving rate of the household sector was slightly in the negative as consumption expenditure exceeded the disposable income. Adjusted disposable income describing households' economic well-being contracted slightly year-on-year. The profit share of the non-financial corporation sector decreased a little from one year ago, while expenditure on wages and salaries remained unchanged. These data derive from Statistics Finland’s quarterly sector accounts.
Key indicators for households and non-financial corporations, seasonally adjusted
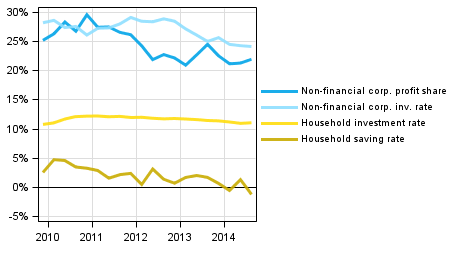
In the third quarter of 2014, the profit share of non-financial corporations, or the share of profits in value added, grew slightly to 21.9 per cent. The investment rate of non-financial corporations, or the proportion of investments in value added, was 24.1 per cent. The investment rate did not change much compared with the previous quarter. The key figures were calculated from seasonally adjusted time series.
Households' saving rate was -1.3 per cent in the third quarter of 2014. In the previous quarter, the figure was +1.3 per cent. The saving rate refers to the proportion of savings in disposable income. In the third quarter, the investment rate of households accounted for 11.0 per cent of disposable income, which was almost on par with the previous quarter. Most of households' investments were investments in dwellings.
Households' adjusted disposable income decreased from the corresponding quarter in 2013 by 0.8 per cent adjusted for price changes. Adjusted income is the indicator recommended by the OECD for evaluating the economic well-being of households. Adjusted disposable income is derived by adding individual services produced by the public sector, such as education, health and social services, to the disposable income of households.
Sector accounts are calculated only at current prices. However, a volume indicator describing the development adjusted for price changes is calculated for households' adjusted disposable income in a separate Appendix table. The profit share, saving rate and investment rate are calculated from net figures, which means that consumption of fixed capital is taken into account. Households do not include non-profit institutions serving households.
Source: Sector accounts, Statistics Finland
Inquiries: Jesse Vuorinen 029 551 3363, Katri Soinne 029 551 2778, kansantalous.suhdanteet@stat.fi
Director in charge: Leena Storg�rds
Publication in pdf-format (409.0 kB)
- Reviews
- Tables
-
Tables in databases
Pick the data you need into tables, view the data as graphs, or download the data for your use.
Appendix tables
- Figures
-
- Appendix figure 1. Volume development of households adjusted disposable income (19.12.2014)
- Appendix figure 2. Households saving rate (19.12.2014)
- Appendix figure 3. Households investment rate (19.12.2014)
- Appendix figure 4. Non - financial corporations profit share (19.12.2014)
- Appendix figure 5. Non - financial corporations investment rate (19.12.2014)
- Revisions in these statistics
-
- Revisions in these statistics (19.12.2014)
Updated 19.12.2014
Official Statistics of Finland (OSF):
Quarterly sector accounts [e-publication].
ISSN=2243-4992. 3rd quarter 2014. Helsinki: Statistics Finland [referred: 16.4.2024].
Access method: http://www.stat.fi/til/sekn/2014/03/sekn_2014_03_2014-12-19_tie_001_en.html