

Published: 29 September 2017
Households’ financial assets still grew faster than liabilities in the second quarter of 2017
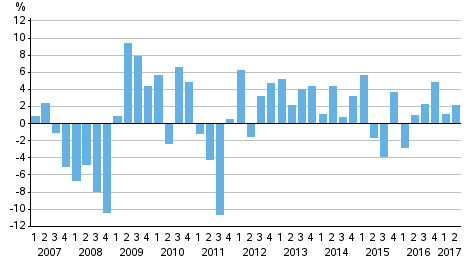
Households’ financial assets amounted to EUR 301.4 billion and liabilities to EUR 157.5 billion at the end of June. When liabilities are deducted from financial assets, net financial assets are EUR 143.9 billion. During the second quarter of 2017, net financial assets increased by EUR 3.0 billion. Liabilities grew by EUR 1.7 billion from the previous quarter and assets by EUR 4.7 billion. The growth in net financial assets continued for the fifth quarter in a row. These data appear from Statistics Finland's financial accounts statistics.
Change from the previous quarter in households net financial assets
Households’ gains from shares enlarged book-entry accounts and current accounts
The value of financial assets held by households developed positively during the quarter. Households received a total of EUR 3.1 billion in holding gains, most of which, EUR 2.2 billion, came from quoted shares.
In addition to holding gains, the level of households’ financial assets was raised by the positive investment flow. In April to June, households made EUR 1.6 billion more new investments in financial assets than they withdrew from financial assets. Assets flowed to wallets as well as to current accounts and other transferable deposits on net to the tune of EUR 2.3 billion on account of enterprises’ dividend payment in spring, for example. Fund investments also grew on net, but investments in quoted shares, term deposits and debt securities decreased on net. The development has been similar in most quarters in the past few years. The share of deposits in households' all financial assets stood at 28.3 per cent at the end of June.
Households’ indebtedness ratio rose
Households’ loan debts grew by EUR 1.7 billion in the second quarter of 2017. Loan debts amounted to EUR 145.0 billion at the end of the quarter. Households' indebtedness ratio rose by 1.2 percentage points from the previous quarter to 127.6 per cent. Households' indebtedness ratio is calculated as the ratio of the amount of loan debts at the end of a quarter to their total disposable income during the preceding four quarters.
Non-financial corporations’ debt financing continued to grow
Non-financial corporations’ debt financing increased by EUR 9.2 billion in April to June to EUR 234.1 billion. Non-financial corporations’ financing in the form of debt securities grew by EUR 2.3 billion and rose to EUR 32.3 billion, while non-financial corporations' loan debts went up by EUR 6.9 billion and reached EUR 201.8 billion. Debt financing refers to the total of loan debts and financing in the form of debt securities. Here, the non-financial corporations sector has been limited so that it does not include financial and insurance corporations nor housing companies or other housing associations.
Source: Financial accounts, Statistics Finland
Inquiries: Peter Parkkonen 029 551 2571, Henna Laasonen 029 551 3303, rahoitus.tilinpito@stat.fi
Director in charge: Ville Vertanen
Publication in pdf-format (247.4 kB)
- Tables
-
Tables in databases
Pick the data you need into tables, view the data as graphs, or download the data for your use.
Appendix tables
- Figures
- Revisions in these statistics
-
- Revisions in these statistics (29.9.2017)
Updated 29.9.2017
Official Statistics of Finland (OSF):
Financial accounts [e-publication].
ISSN=1458-8145. 2nd quarter 2017. Helsinki: Statistics Finland [referred: 18.4.2024].
Access method: http://www.stat.fi/til/rtp/2017/02/rtp_2017_02_2017-09-29_tie_001_en.html