Published: 11 June 2014
Confirmed result: Left Alliance and Finns Party successful in the European Parliament elections 2014
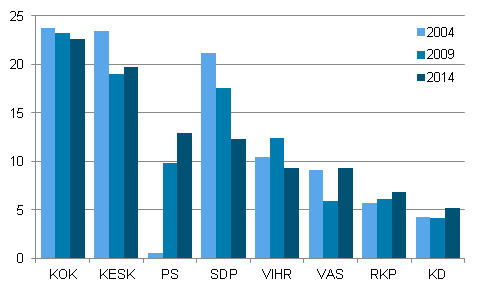
The Left Alliance won one seat in the European Parliament and support for the party rose to 9.3 per cent, which is 3.4 percentage points higher than in the previous European Parliament elections. Compared to the 2009 European Parliament elections, the share of votes cast for the Finns Party rose by 3.1 percentage points to 12.9 per cent. The Finns Party won one additional seat in the election, which raises the number of the party's seats in the European Parliament to two.
Support for the largest parties in the European Parliament elections in 2004 to 2014 (%)

The Christian Democrats that were in an electoral alliance with the Finns Party in the previous European Parliament elections received 5.2 per cent of votes cast increasing their support by 1.1 percentage points compared to the previous European Parliament elections. Despite the increase in the share of votes cast, the party lost their only seat in the European Parliament
The biggest losers in the elections were the Finnish Social Democratic Party and the Green League. The Finnish Social Democratic Party received a 12.3 per cent support in the elections, which was 5.2 percentage points lower than in the previous European Parliament elections. Despite the decrease in the share of votes cast, the party maintained its two seats in the European Parliament. Compared to the previous European Parliament elections, the share of votes cast for the Green League decreased by 3.1 percentage points to 9.3 per cent and the party lost its second seat.
Support for the largest parties in the European Parliament elections in 2014, 2009, 2004, 1999 and 1996
| Party | European Parliament elections 2014 |
European Parliament elections 2009 |
European Parliament elections 2004 |
European Parliament elections 1999 |
European Parliament elections 1996 |
| National Coalition Party KOK |
22.6 | 23.2 | 23.7 | 25.3 | 20.2 |
| Centre Party of Finland KESK |
19.7 | 19.0 | 23.4 | 21.3 | 24.4 |
| The Finns Party PS |
12.9 | 9.8 | 0.5 | 0.8 | 0.7 |
| The Finnish Social Democratic Party SDP |
12.3 | 17.5 | 21.2 | 17.9 | 21.5 |
| Green League VIHR |
9.3 | 12.4 | 10.4 | 13.4 | 7.6 |
| The Left Alliance VAS |
9.3 | 5.9 | 9.1 | 9.1 | 10.5 |
| Swedish People's Party in Finland RKP |
6.8 | 6.1 | 5.7 | 6.8 | 5.8 |
| Christian Democrats in Finland KD |
5.2 | 4.2 | 4.3 | 2.4 | 2.8 |
The National Coalition Party and the Centre Party both secured three seats in the European Parliament and thus maintained their previous number of seats. The National Coalition Party got the largest share of all votes cast, namely 22.6 per cent. Its share of votes cast decreased by 0.6 percentage points from the previous European Parliament elections. The Centre Party received 19.7 per cent of all votes cast and its share of votes cast rose by 0.6 percentage points compared to the previous European Parliament elections. The Swedish People’s Party got a 6.8 per cent share of all the votes cast and managed to keep its only seat.
Votes cast for the largest parties and seats in the European Parliament elections 2014, 2009 and 2004
| Party | European Parliament elections 2014 votes |
European Parliament elections 2009 votes |
European Parliament elections 2004 votes |
European Parliament elections 2014 places |
European Parliament elections 2009 places |
European Parliament elections 2004 places |
| National Coalition Party KOK |
390,376 | 386,416 | 392,771 | 3 | 3 | 4 |
| Centre Party of Finland KESK |
339,895 | 316,798 | 387,217 | 3 | 3 | 4 |
| The Finns Party PS |
222,457 | 162,930 | 8,900 | 2 | 1 | 0 |
| The Finnish Social Democratic Party SDP |
212,781 | 292,051 | 350,525 | 2 | 2 | 3 |
| Green League VIHR |
161,263 | 206,439 | 172,844 | 1 | 2 | 1 |
| The Left Alliance VAS |
161,074 | 98,690 | 151,291 | 1 | 0 | 1 |
| Swedish People's Party in Finland RKP |
116,747 | 101,453 | 94,421 | 1 | 1 | 1 |
| Christian Democrats in Finland KD |
90,586 | 69,458 | 70,845 | 0 | 1 | 0 |
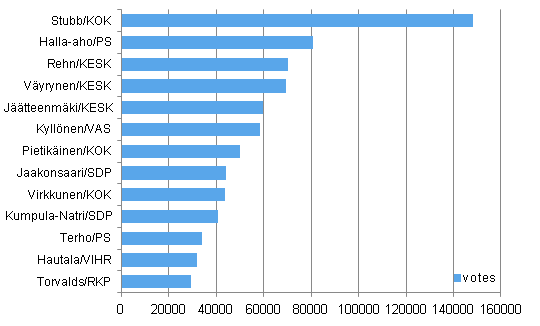
Alexander Stubb of the National Coalition Party was the biggest winner of the European Parliament elections 2014 with 148,190 votes. Jussi Halla-aho of the Finns Party received the second most votes (80,772) and Olli Rehn of the Centre Party was third with 70,398 votes. Nils Torvalds of the Swedish People's Party got elected with the lowest number of personal votes, 29,355. The female candidate who received most votes in the European Parliament elections 2014, Sari Essayah (61,264) of the Christian Democrats, did not get elected. Finland elected 13 representatives to the European Parliament. Six of the elected representatives have no prior experience of the European Parliament.
Finnish Members elected to the European Parliament and their number of votes in 2014

The new European Parliament convenes for the first time on 1 July 2014. The Members of the European Parliament elected in Finland will join the political groups of the European Parliament.
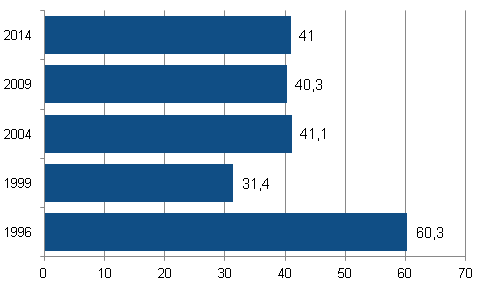
Voting turnout in these European Parliament elections was 41.0 per cent, which is 0.7 percentage points up from the 2009 European Parliament elections. Voting was liveliest in the Åland electoral district, where voting turnout rose to 57.5 per cent. Voting was least active in the North Karelia electoral district, where voting turnout was only 32.9 per cent. Of individual municipalities, the country's highest voting turnout was in Kauniainen (71.2 per cent) and the lowest in Kaavi (27.6 per cent).
Voting turnout in the European Parliament elections in 1996 to 2014, Finnish citizens resident in Finland (%)

Statistics Finland's election result services
Statistics Finland's free of charge election map service on the web contains data illustrated by maps and charts on the European Parliament elections. The themes covered will include voting turnout, the party with the most votes and support the elected members by municipality. More detailed election result data are available in Statistics Finland's PX-Web database service where users can compile customised statistical tables on the elections.
Source: European Parliament Elections 2014, Statistics Finland
Inquiries: Kimmo Moisio 029 551 3239, Jaana Asikainen 029 551 3506, vaalit@stat.fi
Director in charge: Riitta Harala
Publication in pdf-format (336.3 kB)
- Tables
-
Tables in databases
Pick the data you need into tables, view the data as graphs, or download the data for your use.
Appendix tables
- 1. Finnish members of the European Parliament elected in the European Parliament elections 2014, votes cast for them, their party as well as their political group in the European Parliament (11.6.2014)
- 2. European Parliament, names and abbreviations of political groups and the parties of the group's Finnish members in 2014 (11.6.2014)
- Quality descriptions
Updated 11.6.2014
Official Statistics of Finland (OSF):
European Parliament elections [e-publication].
ISSN=1798-291X. 2014. Helsinki: Statistics Finland [referred: 20.4.2024].
Access method: http://www.stat.fi/til/euvaa/2014/euvaa_2014_2014-06-11_tie_001_en.html

