Long-term examination
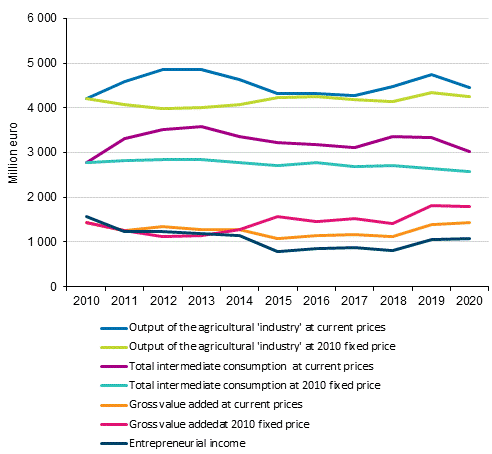
The figure below shows the output, intermediate consumption and the development of their difference, i.e. the value added, in agriculture from 2010 to 2020, both at current prices and as a volume series. The volume series describes changes in numbers and quality (volume).
The current price series of agricultural output largely follows the development of the producer price index of agricultural products. The prices went up clearly in the early years of the decade, but the price development made a downturn in 2014 and returned in 2015 to 2017 to the same level as in 2010. In 2018 and 2019, the price development was positive for farmers, but the favourable development appears to have made a turn in 2020. When comparing the development of the volume of the total output in agriculture between 2010 and 2020, it can be said that the volume has remained almost unchanged.
Total output, intermediate consumption, value added and entrepreneurial income in agriculture 2010 to 2020

The current value of intermediate consumption rose right at the beginning of the period until 2013, after which the value decreased until 2017. By contrast, the volume of intermediate consumption has decreased fairly steadily throughout the reference period, from 2010 to 2020 the change was around -7 per cent. Among individual intermediate groups, it should be noted that the volume of the use of fertilisers has decreased fairly steadily by over 20 per cent over the 11-year period.
The volume of gross value added in agriculture rose by around 23 per cent in 2020 compared to 2010. Because the volume of output remained almost unchanged and the volume of intermediate consumption fell by seven per cent between the above-mentioned years, the growth in the volume of value added can be interpreted as being caused by more efficient use of production inputs. However, the old Finnish saying 'the years are not brothers' should be borne in mind particularly when it comes to agriculture: comparison between individual years does not justify making profound conclusions about the growth of productivity in agriculture and the reasons for it.
When consumption of fixed capital, i.e. depreciations, are subtracted from gross value added, net value added is obtained. Entrepreneurial income from agriculture is derived when other subsidies on production are added to and salaries paid, rents paid on land and interest paid are subtracted from the net value added. Other subsidies on production refer to subsidies that cannot be directly linked to a particular product. At this time of the year, with the exception of subsidies on production, very little statistical data are available for estimating entrepreneurial income in a completely reliable manner. Based on the currently available data, entrepreneurial income from agriculture at current prices is estimated to grow slightly in 2020 compared to the previous year.
The database tables of the statistics contain the current priced values of all product and intermediate items, the values calculated at the previous year's prices, and the volume series of the reference year 2010. All product items have been calculated both at producer prices and at basic prices. The basic price refers to the producer price to which subsidies on products have been added and from which taxes on products have been deducted. In addition, a separate database table describes the numbers of staff-years worked by farmers and salaried agricultural labour force.
Source: Economic Accounts for Agriculture (EAA), Statistics Finland
Inquiries: Hannu Maliniemi 029 551 2796, maataloustilastot@stat.fi
Head of Department in charge: Mari Yl�-Jarkko
Updated 11.12.2020
Official Statistics of Finland (OSF):
Economic Accounts for Agriculture (EAA) [e-publication].
ISSN=2670-1006. 2020,
Long-term examination
. Helsinki: Statistics Finland [referred: 20.4.2024].
Access method: http://www.stat.fi/til/eaa/2020/eaa_2020_2020-12-11_kat_001_en.html

